The Most Popular Lipstick Color in Every State
We analyzed three and a half years of Google searches for 13 lipstick shades in all 50 states and Washington, DC. Red wins everywhere. The real story is the shade each state searches for more than the rest of the country.
Find your state- 51 of 51states and DC where red is the most searched shade
- 2xmore searches for black lipstick than for nude
- +101%growth in US lip liner searches since spring 2023
Red wins in every state
Red is the most searched lipstick shade in all 50 states and Washington, DC. It takes 31% of every shade search in the US, and no state comes close to flipping it.
Black is a clear second at 17%, ahead of pink at 15%, brown at 9% and nude at 8%.
The reddest states are up north
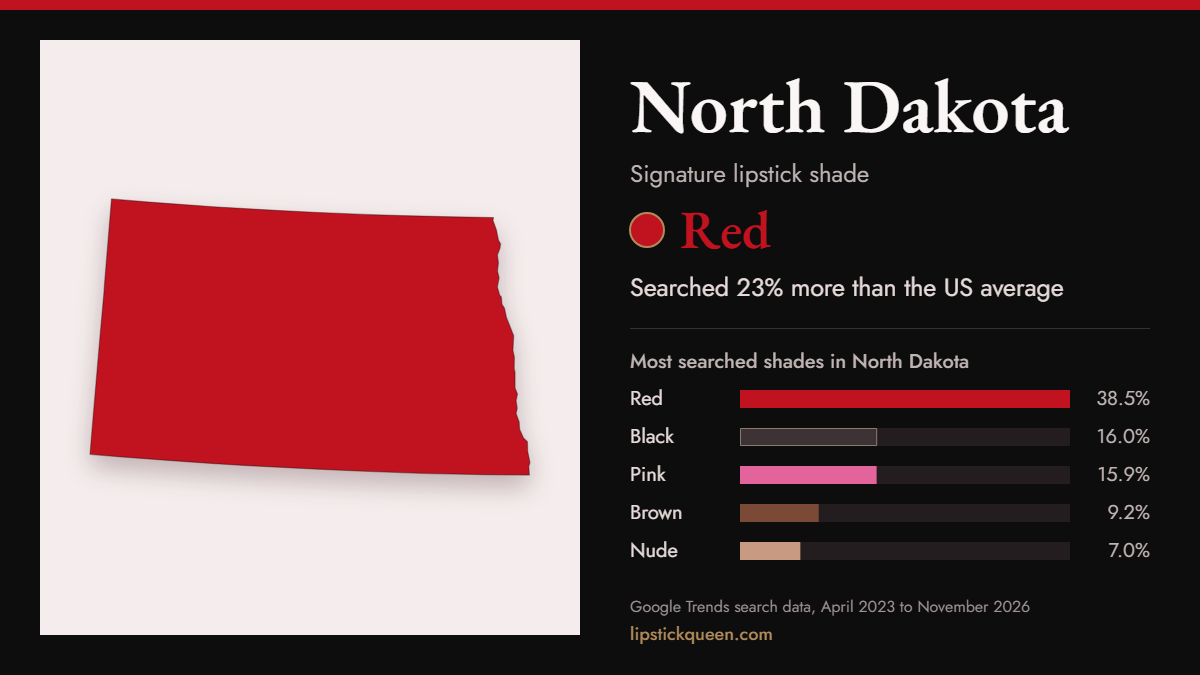
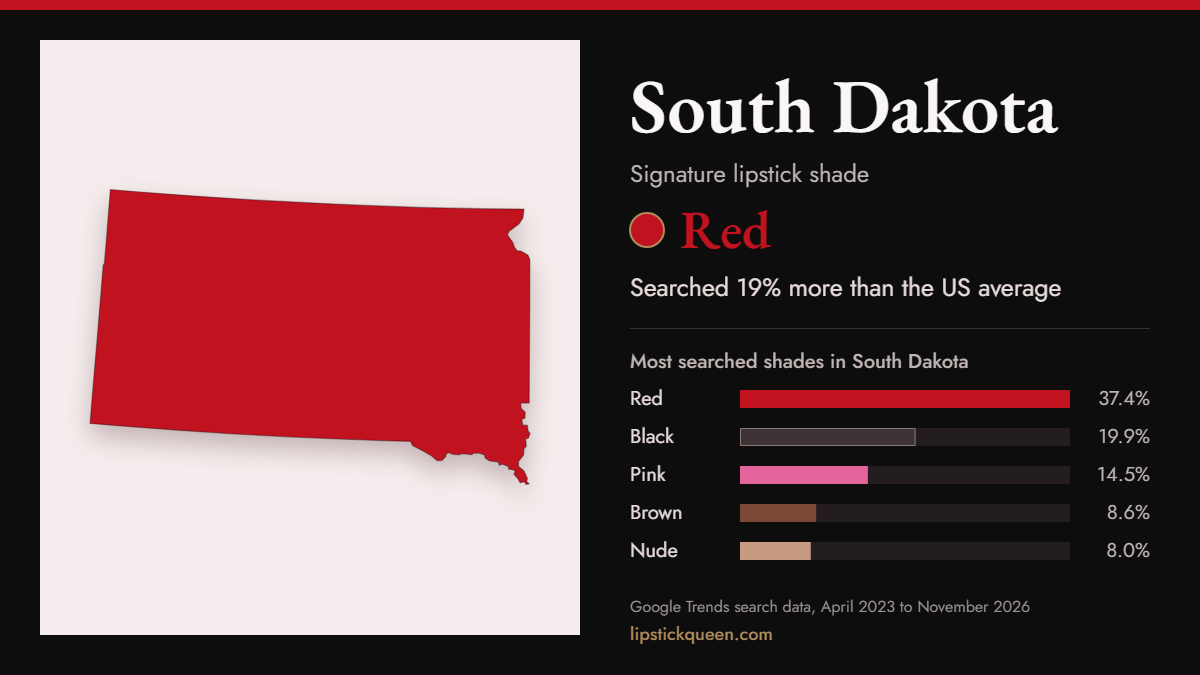
North Dakota is the reddest state in America: 38% of its lipstick shade searches are for red. South Dakota, Vermont, Montana and New York follow.
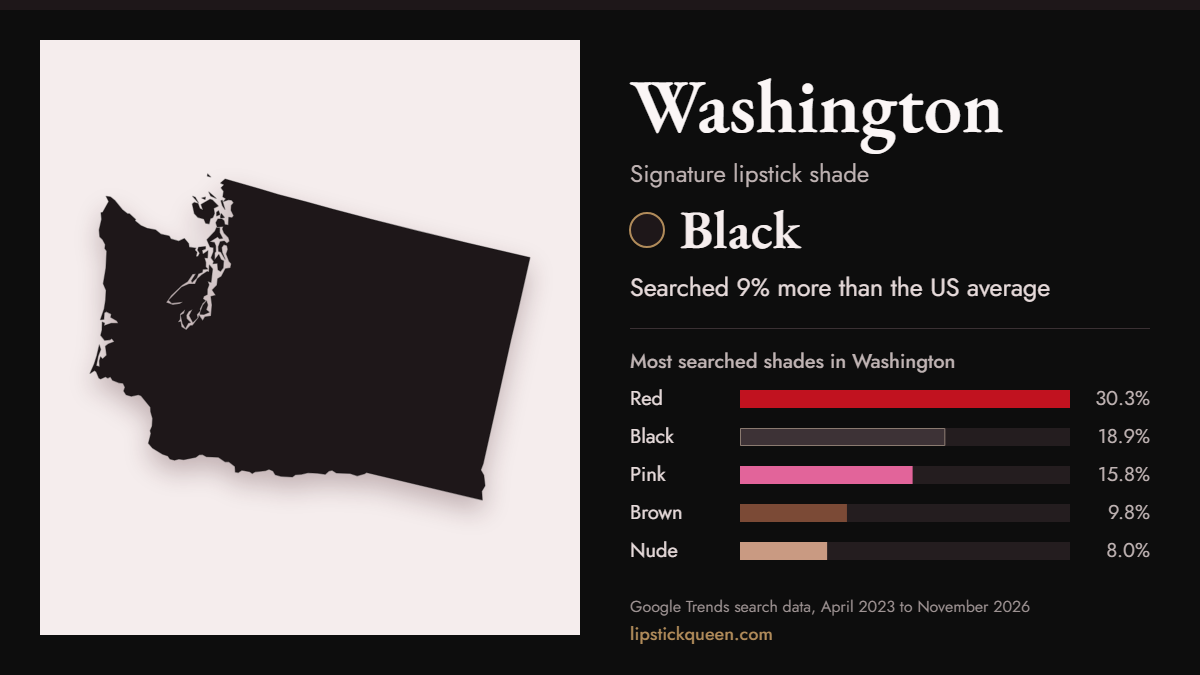
Red has the smallest share in Massachusetts, New Jersey and Washington, where it still leads with about 30%. Taller states on the map search red more.
Every state has a signature shade
Ranking shades by volume gives you the same answer 51 times. So we asked a better question: which shade does each state search for more than the rest of the US?
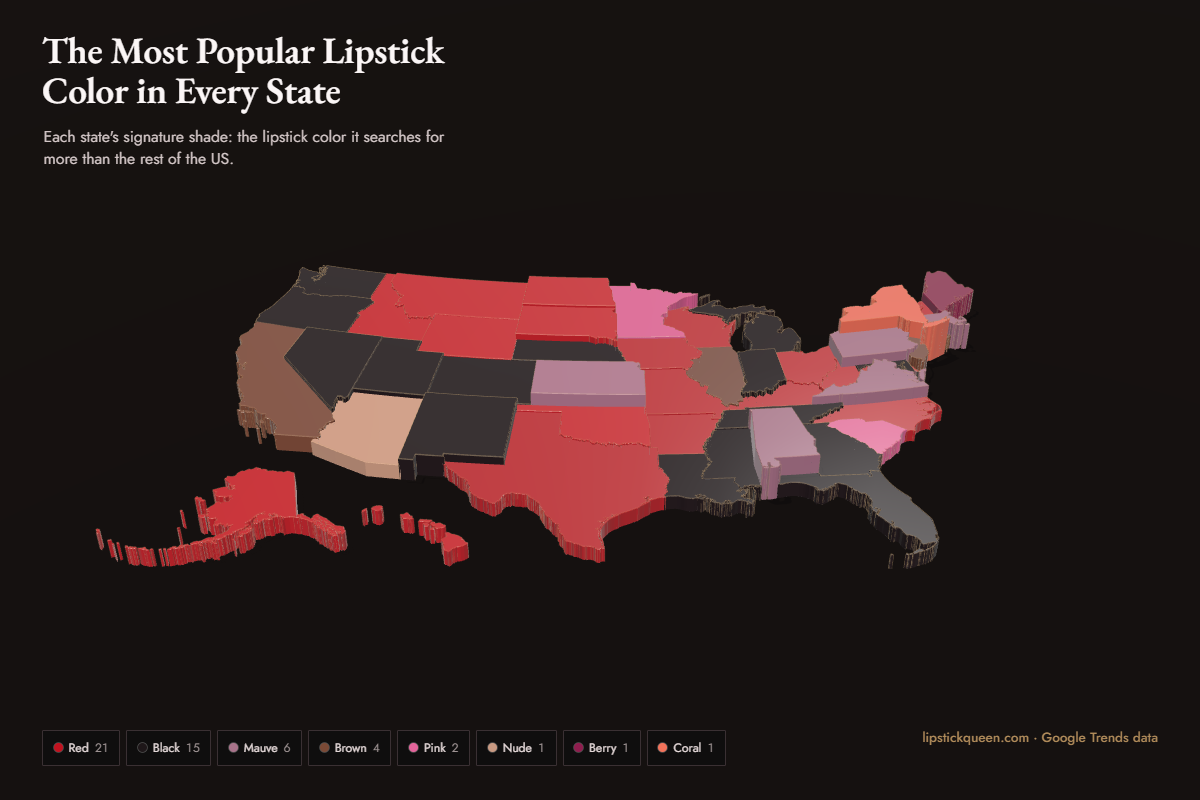
That is its signature shade. Red is the signature in 21 states, black in 15, mauve in 6 and brown in 4. Taller states lean harder toward their shade.
Black lipstick, coast to coast
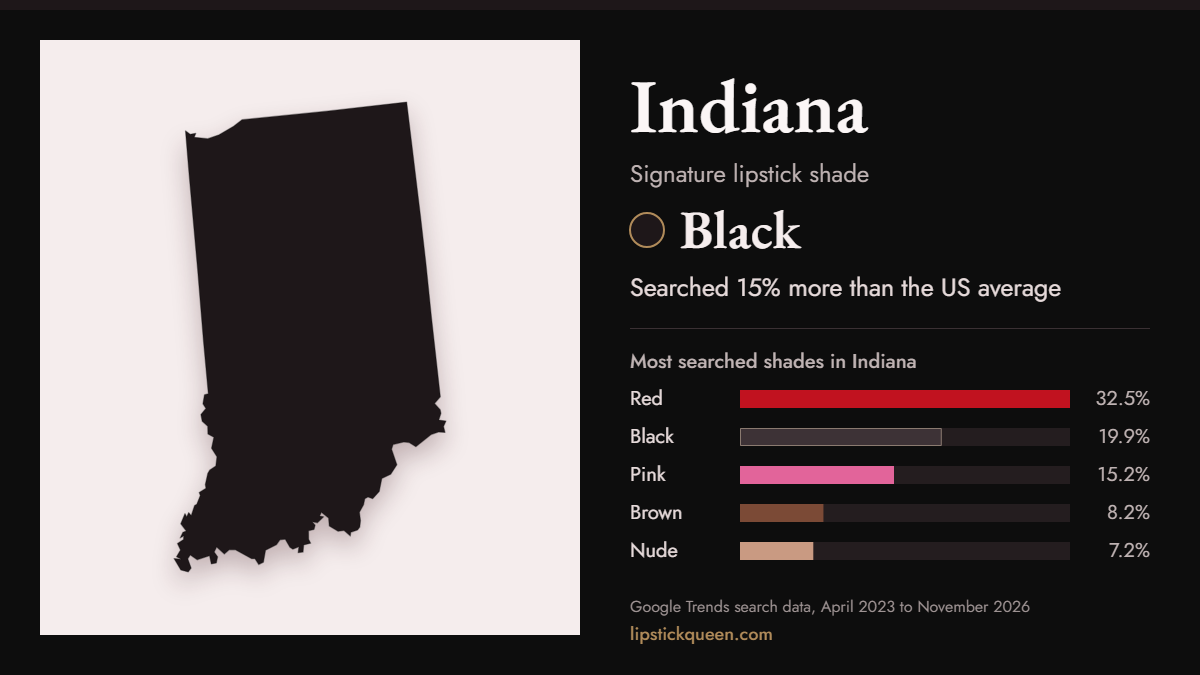
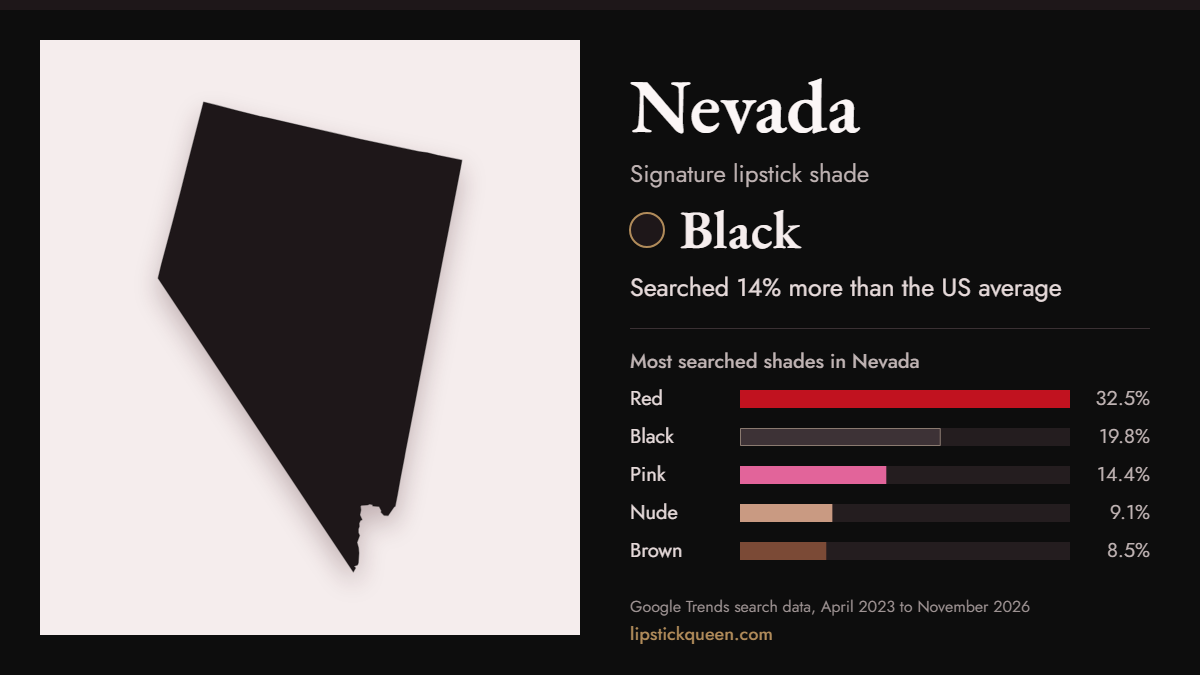
Black lipstick gets 2 times as many searches as nude, and it is the signature shade in 15 states that share no obvious region: from New Mexico, Indiana and Nevada to Florida and Washington.
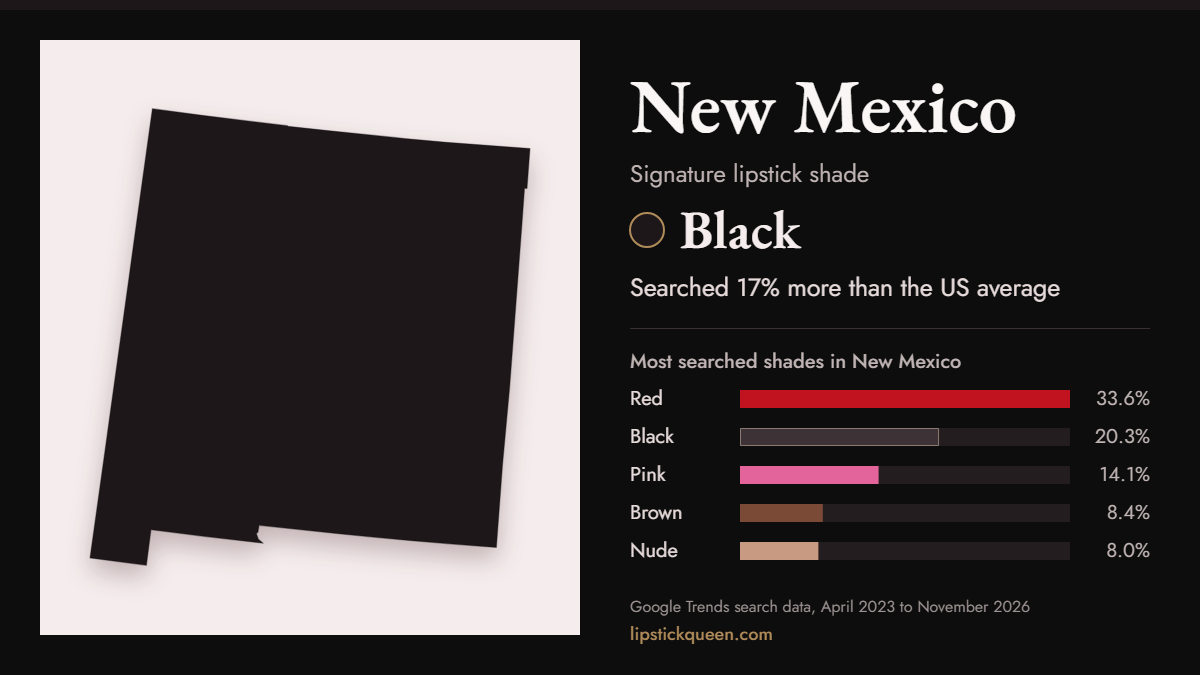
New Mexico leads, searching black 17% more than the national average. If you are curious, here is how to wear black lipstick without looking costume-ready.
The mauve states
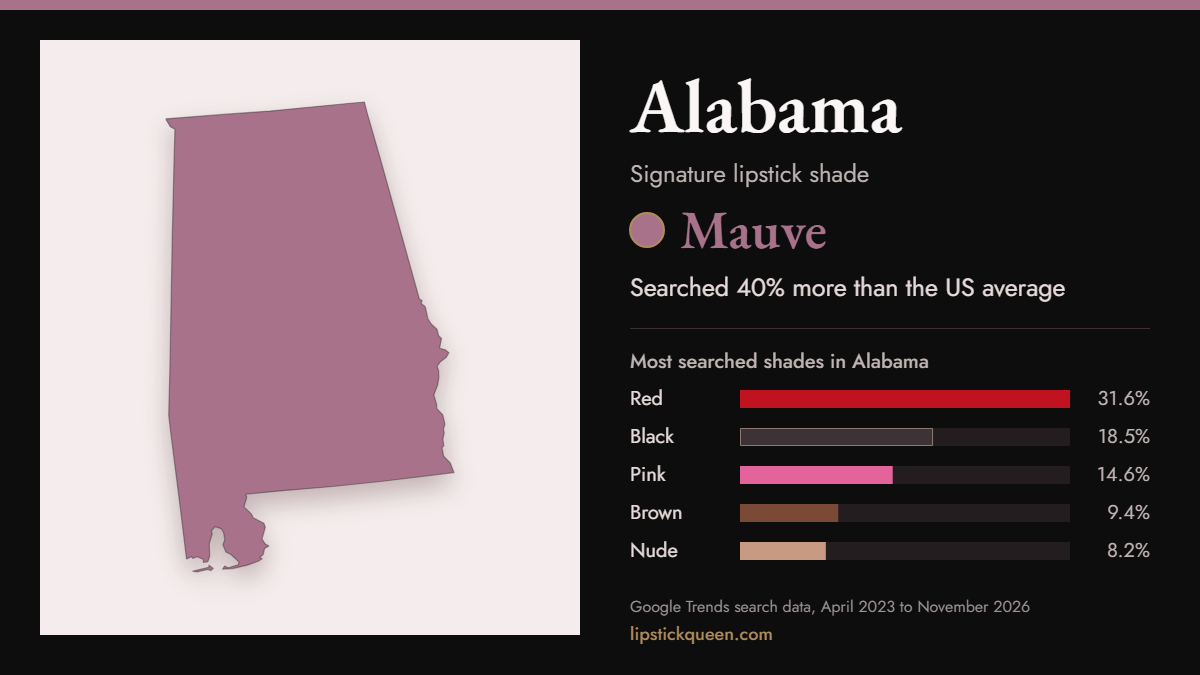
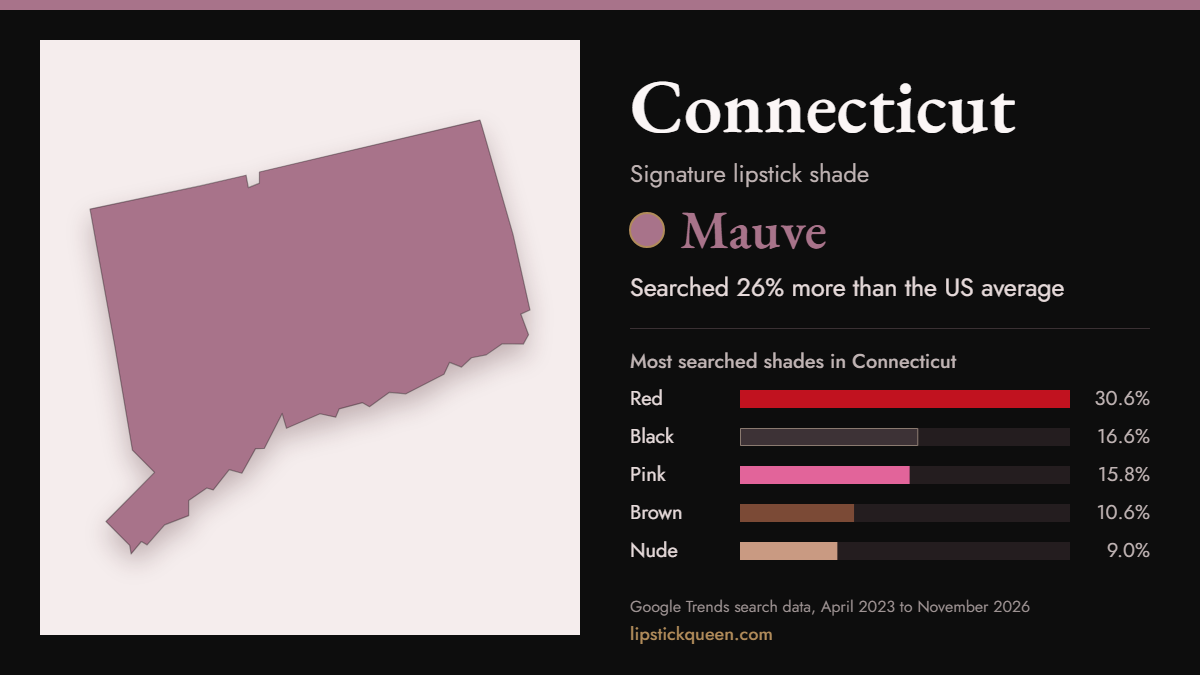
Six states pick mauve, the dusty pink-brown that rarely tops anyone's list. Alabama leads by a wide margin, searching it 40% more than the US average.
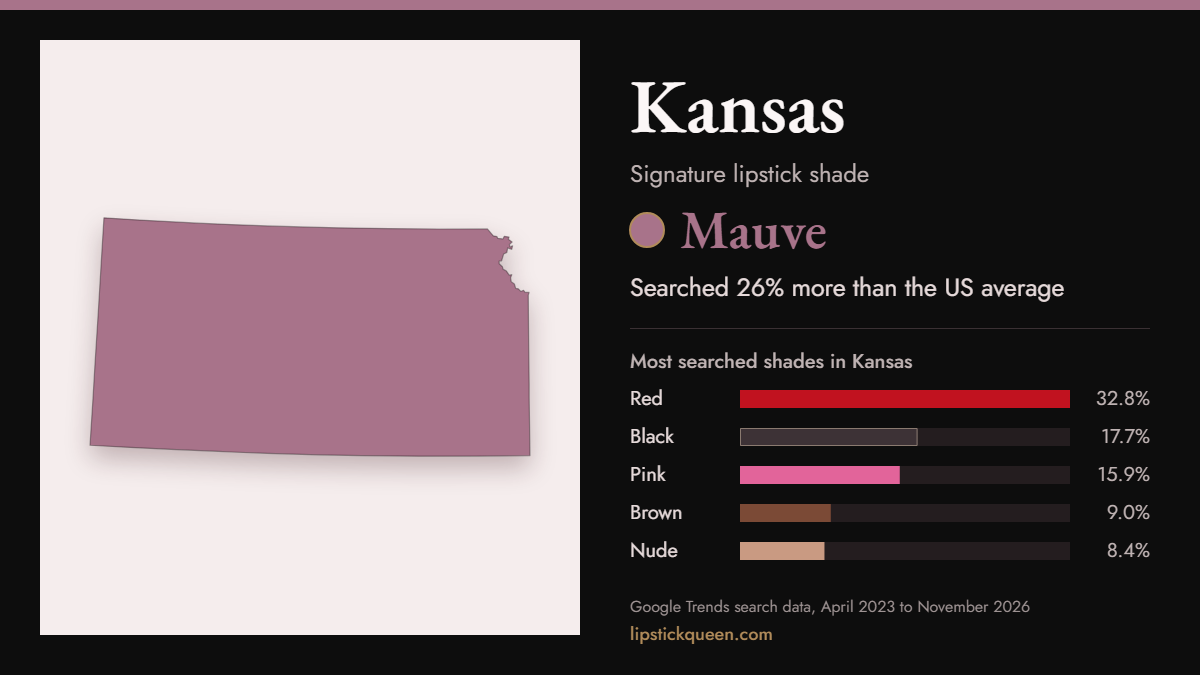
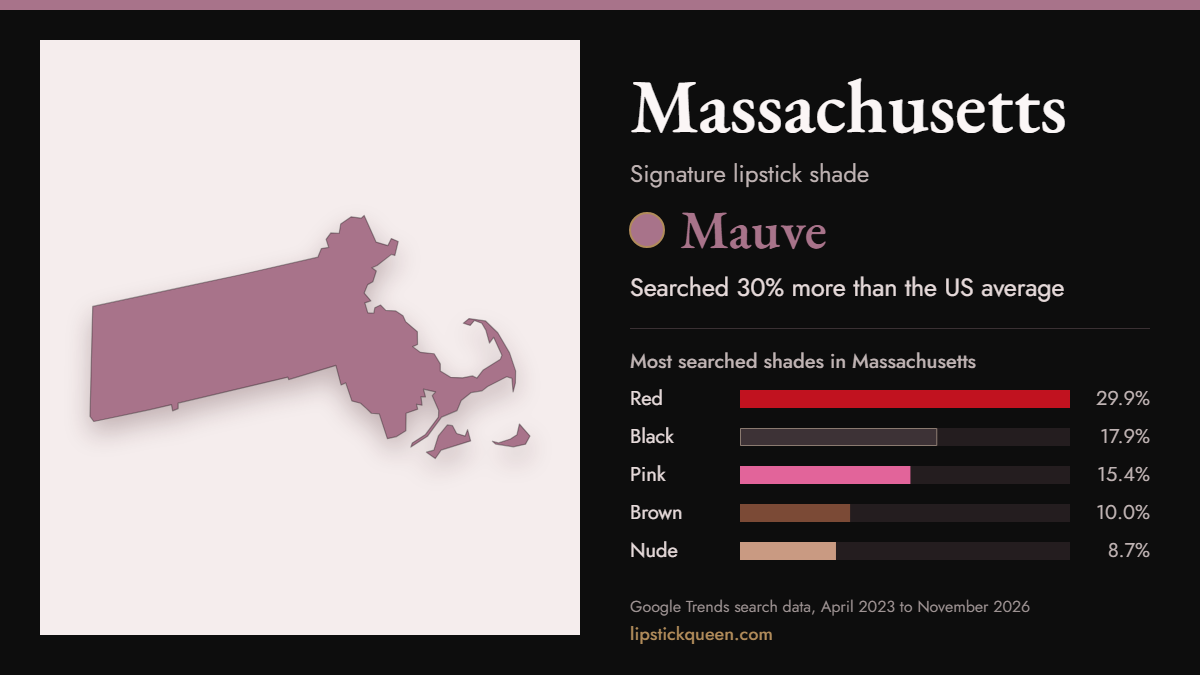
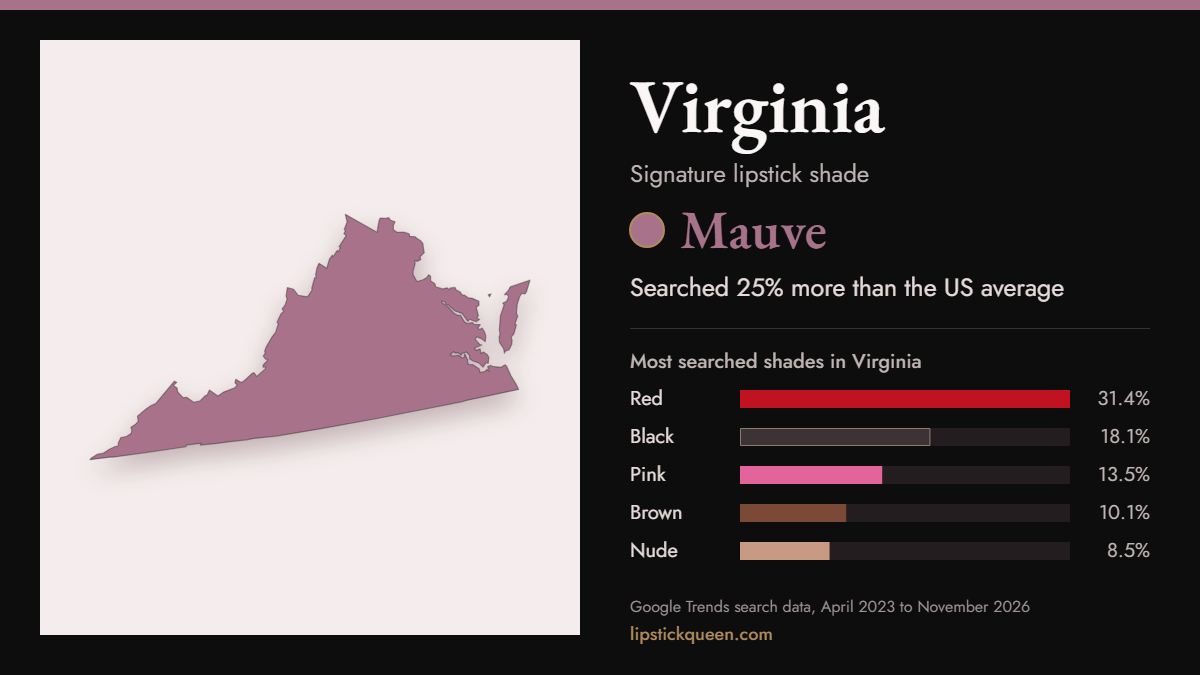
The rest sit mostly in the Northeast: Massachusetts, Pennsylvania, Kansas, Connecticut and Virginia.
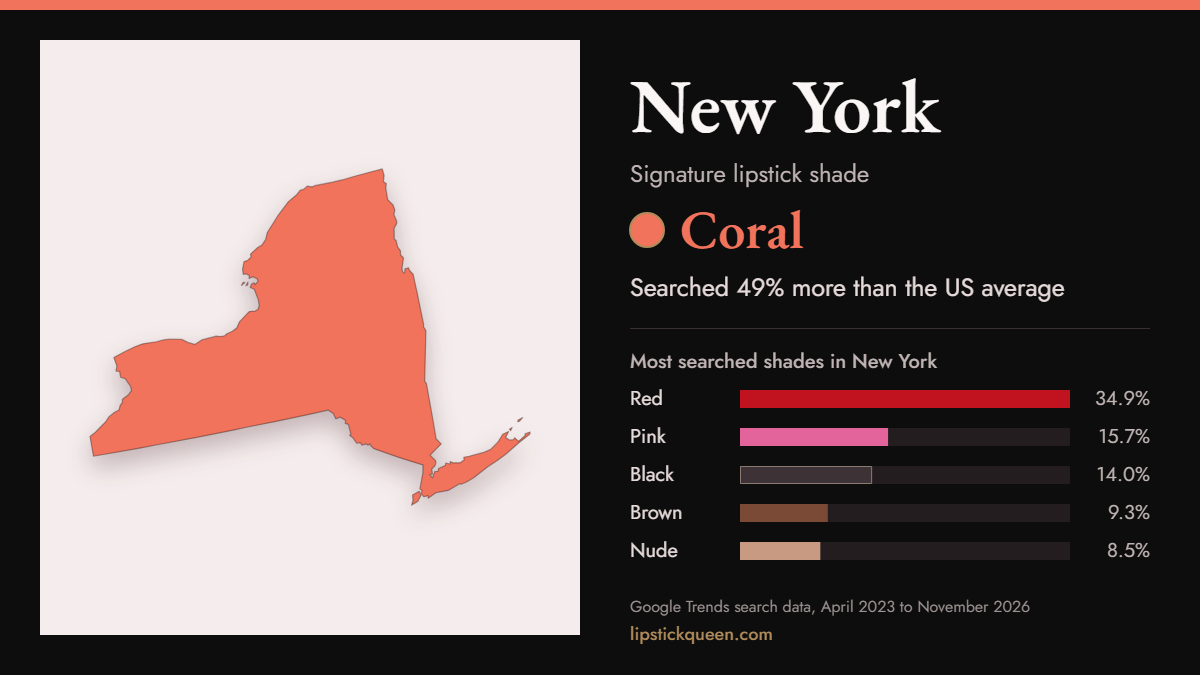
New York is the coral state
New York has the strongest signature in the country. It searches coral lipstick 49% more than the US average, the biggest gap between any state and the national mix.
No other state picked coral. The next strongest fans are Florida and Arizona. Here is how to wear coral lipstick if New York has a point.
Brown, the 90s shade that stayed
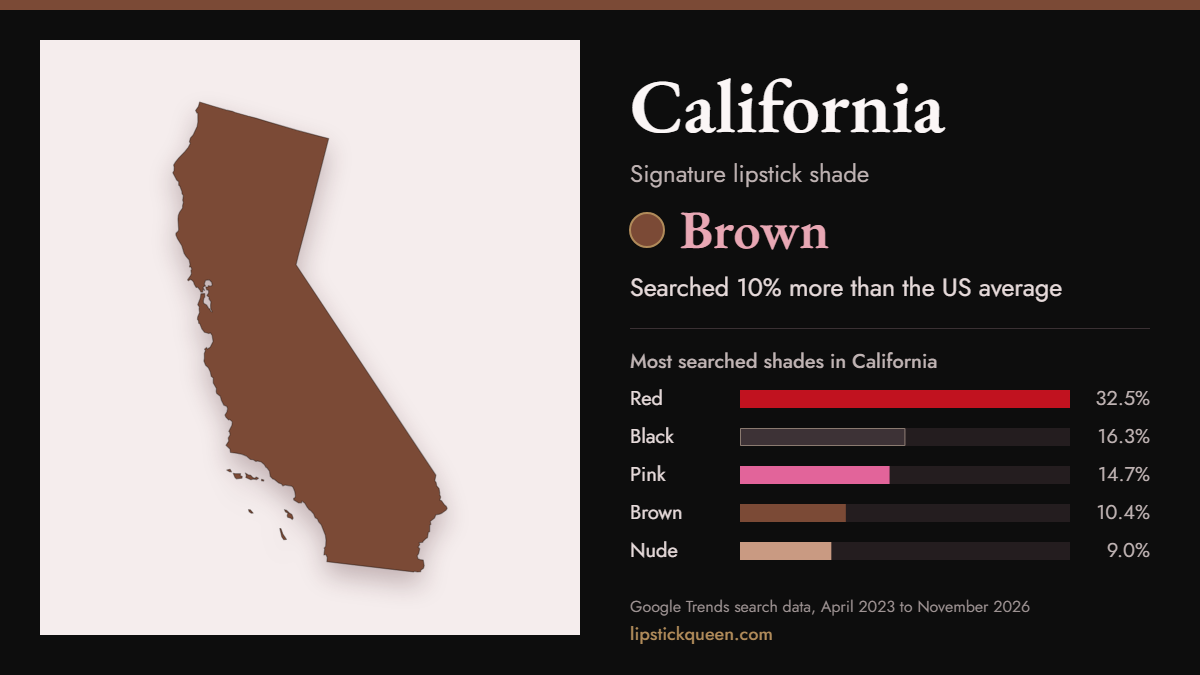
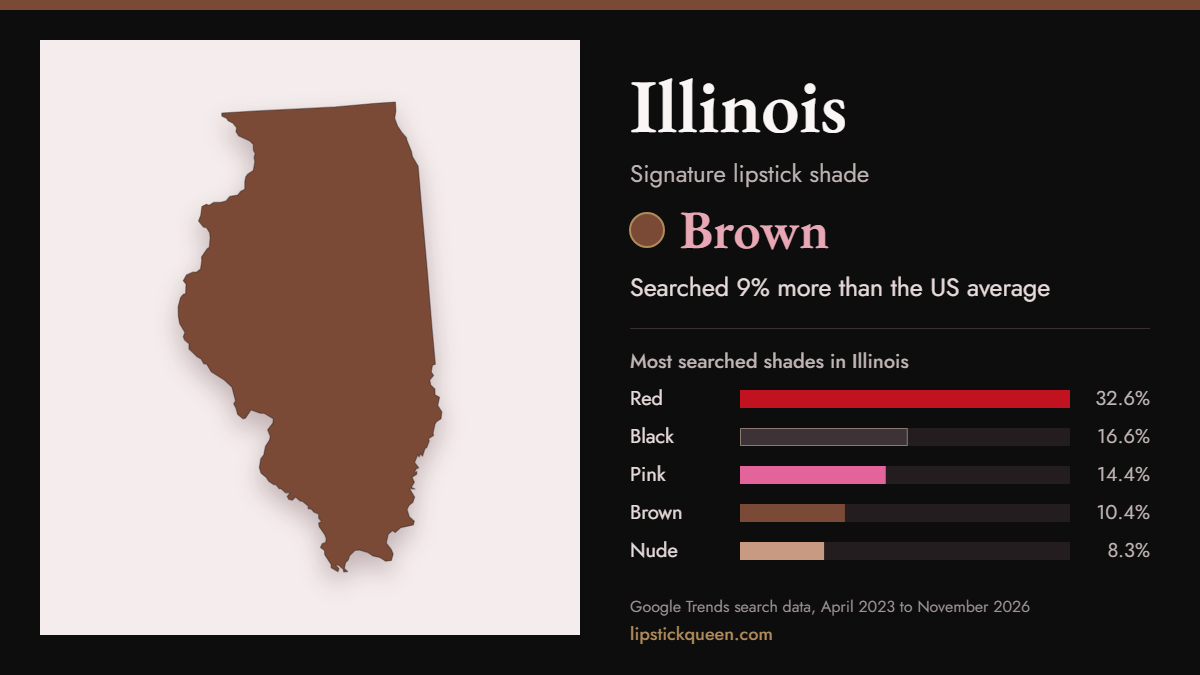
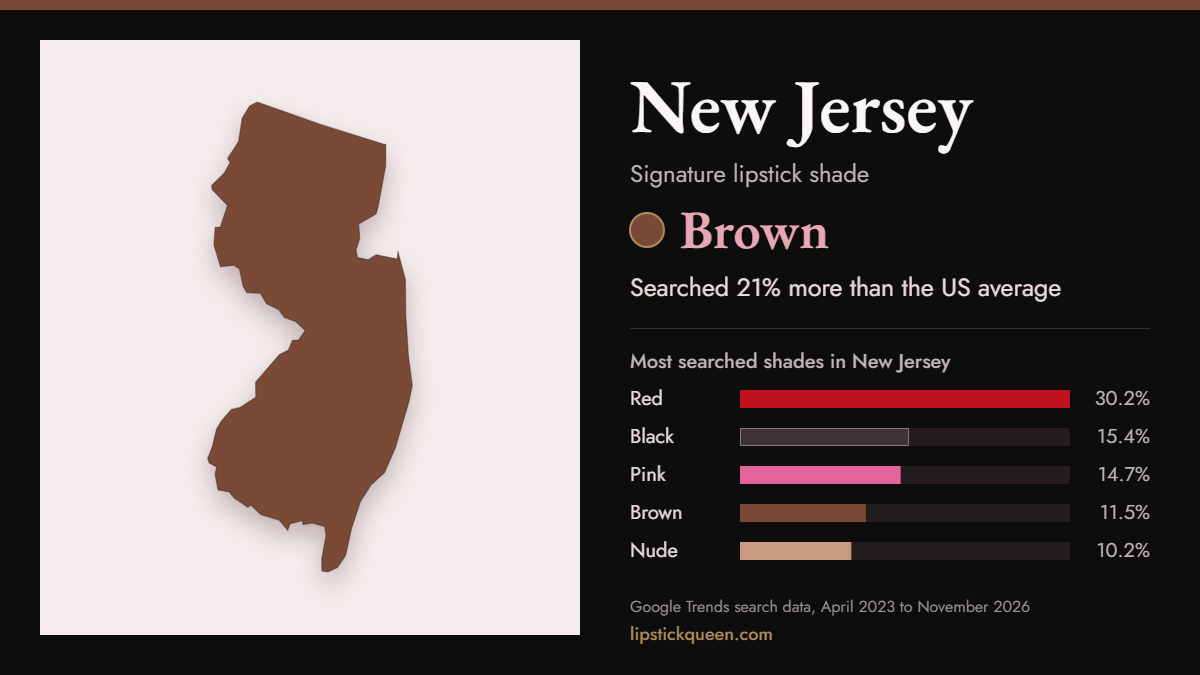
Brown is the signature in New Jersey, California, Rhode Island and Illinois. New Jersey searches it 21% more than average.
Nationally, brown now takes 9% of shade searches, more than nude.
Lip liner went from niche to everywhere
In 2023, lip liner took 6.9% of lip product searches in the average state, and only California and New Mexico gave it 10% or more. By 2025, every state had crossed 10%, and in 2026 the average reached 14.2%.
Lip oil went the other way. In 2023 and 2024 no state searched lip liner more than lip oil. In 2026, 50 of 51 do.
Now find yours
Hover or tap any state for its numbers, click a shade below the map to isolate it, or look up your state and download a card to share.
Hover or tap a state. Click a shade to isolate it.
Find your state's lipstick shade
Pick a state and guess its signature shade. Then see how every shade ranks there and which state searches most like it.
Choose a state and guess its signature shade, or click a state on the map above.
Compare two states
Put any two states side by side to see where their lipstick searches agree and where they split.
Where each shade is searched most
Each map shows one shade. The deeper the color, the more that state searches for it compared with the US average.
Lip liner is the fastest growing lip product
US searches for lip liner are up +101% compared with spring 2023, and lip stain is up +87%. Lipstick itself is flat at -6%, while lip oil has cooled off, down 28% from its 2023 level.
Lipstick still leads with 51% of searches across the five products, followed by lip gloss at 19%, lip liner at 11%, lip oil at 10% and lip stain at 8%.
Monthly Google search interest in the US for each product, where 100 equals its average from April to September 2023. March to July 2026 is left out (see methodology).
Lip liner is a West Coast habit
California, Nevada and Arizona search lip liner the most compared with the US average. At city level the top metro areas are Yuma AZ-El Centro CA, Palm Springs CA, Los Angeles CA and Monterey-Salinas CA.
It is least searched in Wyoming, Maine and Mississippi. New to it? Start with how to apply lip liner.
The lipstick calendar
Every ring is one shade and every slice is one month. A brighter slice means more searches than that shade gets in an average month.
- Red peaks in December, 36% above an average month. The week before Valentine's Day runs 61% to 78% above the yearly average.
- Black peaks in October, 48% above average. Halloween is the obvious suspect.
- Coral is the only shade that peaks in spring. Mauve, brown and nude all peak in November.
- June is the quietest month for almost every shade.
Signature shades in 149 metro areas
The same analysis at city level, using Google's metro areas. Search for your city or filter by shade.
| Metro area | Signature shade | Searches vs US average |
|---|---|---|
| Springfield-Holyoke MA | Coral | 301% more |
| Yuma AZ-El Centro CA | Plum | 272% more |
| Ft. Myers-Naples FL | Coral | 196% more |
| Palm Springs CA | Mauve | 148% more |
| Columbus-Tupelo-West Point MS | Mauve | 123% more |
| Reno NV | Nude | 119% more |
| West Palm Beach-Ft. Pierce FL | Coral | 113% more |
| Macon GA | Black | 75% more |
| Burlington VT-Plattsburgh NY | Black | 73% more |
| Roanoke-Lynchburg VA | Black | 73% more |
| Ft. Smith-Fayetteville-Springdale-Rogers AR | Berry | 72% more |
| Rockford IL | Black | 72% more |
| Boise ID | Pink | 70% more |
| Gainesville FL | Black | 64% more |
| Dothan AL | Black | 62% more |
| Anchorage AK | Black | 60% more |
| Cedar Rapids-Waterloo-Iowa City & Dubuque IA | Red | 60% more |
| Monroe LA-El Dorado AR | Pink | 60% more |
| Amarillo TX | Red | 59% more |
| Lincoln & Hastings-Kearney NE | Black | 59% more |
| Beaumont-Port Arthur TX | Red | 58% more |
| Erie PA | Red | 58% more |
| Salisbury MD | Pink | 57% more |
| South Bend-Elkhart IN | Red | 57% more |
| Springfield MO | Red | 56% more |
| Albany GA | Black | 55% more |
| Corpus Christi TX | Red | 55% more |
| La Crosse-Eau Claire WI | Red | 54% more |
| Toledo OH | Black | 54% more |
| Odessa-Midland TX | Red | 53% more |
| Traverse City-Cadillac MI | Red | 53% more |
| Augusta GA | Nude | 51% more |
| Fargo-Valley City ND | Red | 51% more |
| Biloxi-Gulfport MS | Red | 49% more |
| Davenport IA-Rock Island-Moline IL | Black | 49% more |
| Wichita Falls TX & Lawton OK | Red | 49% more |
| Ft. Wayne IN | Black | 47% more |
| Savannah GA | Black | 47% more |
| Raleigh-Durham (Fayetteville) NC | Mauve | 45% more |
| Sioux Falls(Mitchell) SD | Red | 45% more |
| Bakersfield CA | Red | 44% more |
| Greenville-New Bern-Washington NC | Red | 44% more |
| Youngstown OH | Red | 44% more |
| Lubbock TX | Red | 43% more |
| Green Bay-Appleton WI | Red | 41% more |
| Boston MA-Manchester NH | Mauve | 39% more |
| Columbia-Jefferson City MO | Red | 39% more |
| Evansville IN | Red | 39% more |
| Tyler-Longview(Lufkin & Nacogdoches) TX | Red | 39% more |
| Waco-Temple-Bryan TX | Black | 39% more |
| Baton Rouge LA | Pink | 38% more |
| Eugene OR | Black | 38% more |
| Johnstown-Altoona PA | Red | 38% more |
| Flint-Saginaw-Bay City MI | Red | 37% more |
| Lansing MI | Red | 37% more |
| Peoria-Bloomington IL | Black | 37% more |
| Santa Barbara-Santa Maria-San Luis Obispo CA | Red | 37% more |
| Topeka KS | Red | 37% more |
| Tallahassee FL-Thomasville GA | Red | 36% more |
| Charleston SC | Pink | 35% more |
| Dayton OH | Black | 34% more |
| Memphis TN | Black | 34% more |
| Montgomery (Selma) AL | Black | 34% more |
| Spokane WA | Black | 34% more |
| Colorado Springs-Pueblo CO | Red | 33% more |
| Florence-Myrtle Beach SC | Red | 33% more |
| Lafayette LA | Red | 33% more |
| Wilmington NC | Red | 33% more |
| Chattanooga TN | Red | 32% more |
| Paducah KY-Cape Girardeau MO-Harrisburg-Mount Vernon IL | Red | 32% more |
| Champaign & Springfield-Decatur IL | Red | 31% more |
| San Francisco-Oakland-San Jose CA | Brown | 31% more |
| Pittsburgh PA | Mauve | 30% more |
| Syracuse NY | Nude | 30% more |
| Omaha NE | Black | 28% more |
| Portland-Auburn ME | Pink | 28% more |
| Yakima-Pasco-Richland-Kennewick WA | Red | 28% more |
| Charleston-Huntington WV | Red | 27% more |
| Little Rock-Pine Bluff AR | Black | 27% more |
| Shreveport LA | Red | 27% more |
| Columbus GA | Red | 26% more |
| Denver CO | Mauve | 26% more |
| Des Moines-Ames IA | Red | 26% more |
| Harlingen-Weslaco-Brownsville-McAllen TX | Red | 26% more |
| Harrisburg-Lancaster-Lebanon-York PA | Red | 26% more |
| Knoxville TN | Black | 26% more |
| Fresno-Visalia CA | Nude | 25% more |
| Greenville-Spartanburg SC-Asheville NC-Anderson SC | Black | 25% more |
| New Orleans LA | Black | 25% more |
| El Paso TX | Red | 24% more |
| Jackson MS | Black | 24% more |
| Monterey-Salinas CA | Red | 24% more |
| Tampa-St. Petersburg (Sarasota) FL | Mauve | 23% more |
| Hartford & New Haven CT | Brown | 22% more |
| Honolulu HI | Red | 22% more |
| Norfolk-Portsmouth-Newport News VA | Black | 22% more |
| Rochester NY | Black | 22% more |
| Tri-Cities TN-VA | Red | 22% more |
| Columbia SC | Black | 21% more |
| Las Vegas NV | Black | 20% more |
| Grand Rapids-Kalamazoo-Battle Creek MI | Black | 19% more |
| Indianapolis IN | Black | 19% more |
| Miami-Ft. Lauderdale FL | Nude | 19% more |
| Albany-Schenectady-Troy NY | Black | 18% more |
| Albuquerque-Santa Fe NM | Red | 18% more |
| Madison WI | Black | 18% more |
| Salt Lake City UT | Black | 18% more |
| Tucson (Sierra Vista) AZ | Red | 18% more |
| Tulsa OK | Red | 18% more |
| Wilkes Barre-Scranton PA | Red | 18% more |
| Austin TX | Brown | 17% more |
| Kansas City MO | Red | 17% more |
| Milwaukee WI | Black | 17% more |
| Richmond-Petersburg VA | Black | 17% more |
| Huntsville-Decatur (Florence) AL | Black | 16% more |
| Philadelphia PA | Brown | 16% more |
| Sacramento-Stockton-Modesto CA | Brown | 16% more |
| Baltimore MD | Mauve | 15% more |
| Birmingham AL | Black | 15% more |
| Columbus OH | Black | 15% more |
| Dallas-Ft. Worth TX | Brown | 15% more |
| Minneapolis-St. Paul MN | Pink | 15% more |
| St. Louis MO | Red | 15% more |
| Charlotte NC | Black | 14% more |
| Cleveland-Akron (Canton) OH | Black | 14% more |
| Greensboro-High Point-Winston Salem NC | Black | 14% more |
| Nashville TN | Black | 14% more |
| Wichita-Hutchinson KS | Red | 14% more |
| Atlanta GA | Black | 13% more |
| Buffalo NY | Pink | 13% more |
| Detroit MI | Black | 13% more |
| Houston TX | Nude | 13% more |
| Louisville KY | Black | 13% more |
| Mobile AL-Pensacola (Ft. Walton Beach) FL | Red | 13% more |
| Oklahoma City OK | Red | 13% more |
| Portland OR | Black | 13% more |
| San Diego CA | Brown | 13% more |
| Chicago IL | Brown | 11% more |
| Cincinnati OH | Red | 11% more |
| New York NY | Red | 11% more |
| Phoenix AZ | Nude | 11% more |
| San Antonio TX | Red | 11% more |
| Seattle-Tacoma WA | Black | 11% more |
| Jacksonville FL | Red | 9% more |
| Lexington KY | Red | 9% more |
| Orlando-Daytona Beach-Melbourne FL | Black | 9% more |
| Los Angeles CA | Black | 6% more |
| Providence RI-New Bedford MA | Red | 6% more |
| Washington DC (Hagerstown MD) | Red | 6% more |
149 metro areas
Methodology and data
Source. All figures come from Google Trends for web searches in the United States. We tracked 13 shade searches in the form "red lipstick", "black lipstick" and so on: red, nude, pink, berry, brown, plum, coral, mauve, burgundy, black, orange, purple and peach. We also tracked five lip products: lipstick, lip gloss, lip oil, lip stain and lip liner.
Time window. April 1, 2023 to November 14, 2026. We left out March 22 to July 4, 2026. In those weeks Google Trends recorded a sudden four to five times jump in searches for lipstick, mascara, eyeliner and nail polish at the same time, led by exact product names, while related topics did not move. That pattern does not look like real shopper interest, so it is excluded. We start in April 2023 because Trends shows a level shift across every term in early 2023.
Putting shades on one scale. Google Trends compares up to five searches at a time, so we ran the shades in three groups with "red lipstick" in every group as a common reference.
Year by year. For the lip liner timeline we ran the five lip products separately for each calendar year, with 2023 starting in April and 2026 covering January 1 to March 14 and July 5 to November 14. Kansas showed a short lip liner spike from July 2026, so its 2026 figure uses January to March only. We do not show signature shades by year, because one year of data per state is too thin for a stable signature.
Most searched shade. The shade with the largest share of the 13 shade searches in a state.
Signature shade. The shade whose share in a state is furthest above its US share, weighted by how common the shade is, so a rare shade cannot win on noise. Google Trends reports zero for low-volume searches in small states, so results for smaller states are blended toward the national average in proportion to population. Burgundy and peach are tracked but too rare to be a signature.
Metro areas. The same method applied to Google's metro areas (Nielsen DMA regions). 149 of 210 metro areas had enough data.
Limits. This measures search interest, not sales or what people wear. Searches are in English, and shade names overlap: plenty of browns are sold as nudes. Google Trends values are relative and sampled, so treat small differences between states as close calls.
License. The data and map images are free to use under CC BY 4.0 with a link to this page.
Full results for every state
| State | Signature shade | Signature vs US | Most searched | Closest twin | Graphic |
|---|---|---|---|---|---|
| Alabama | Mauve | 40% more | Red (31.6%) | Tennessee | PNG |
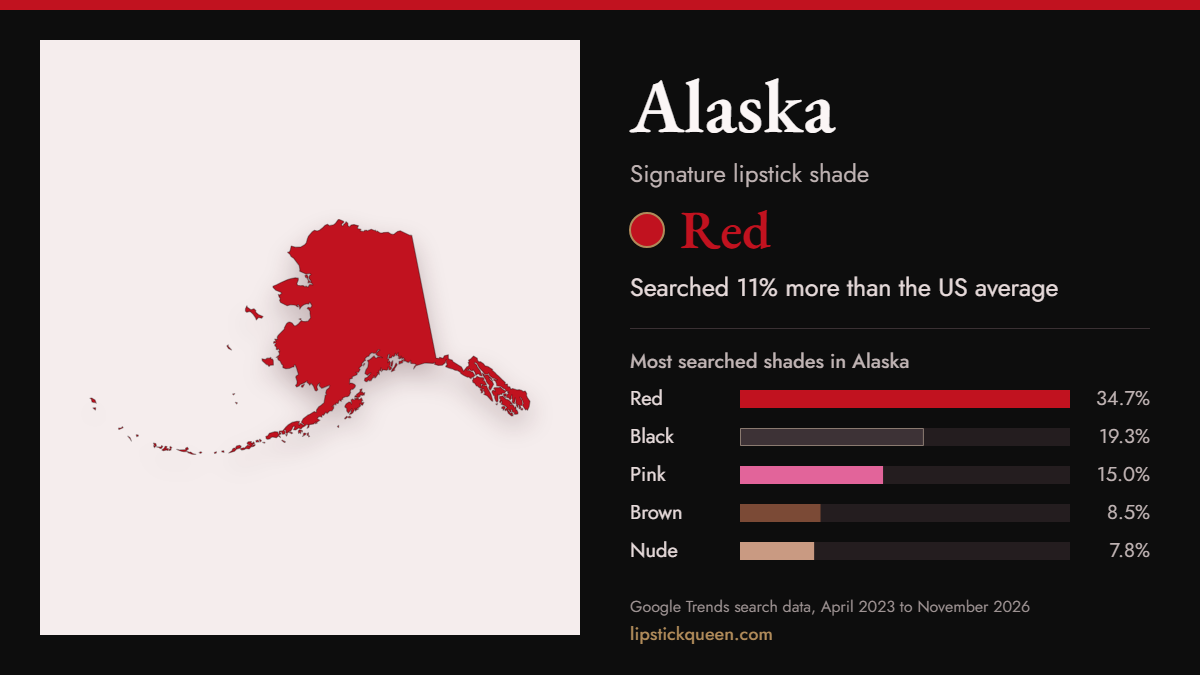
| Alaska | Red | 11% more | Red (34.7%) | Iowa | PNG |
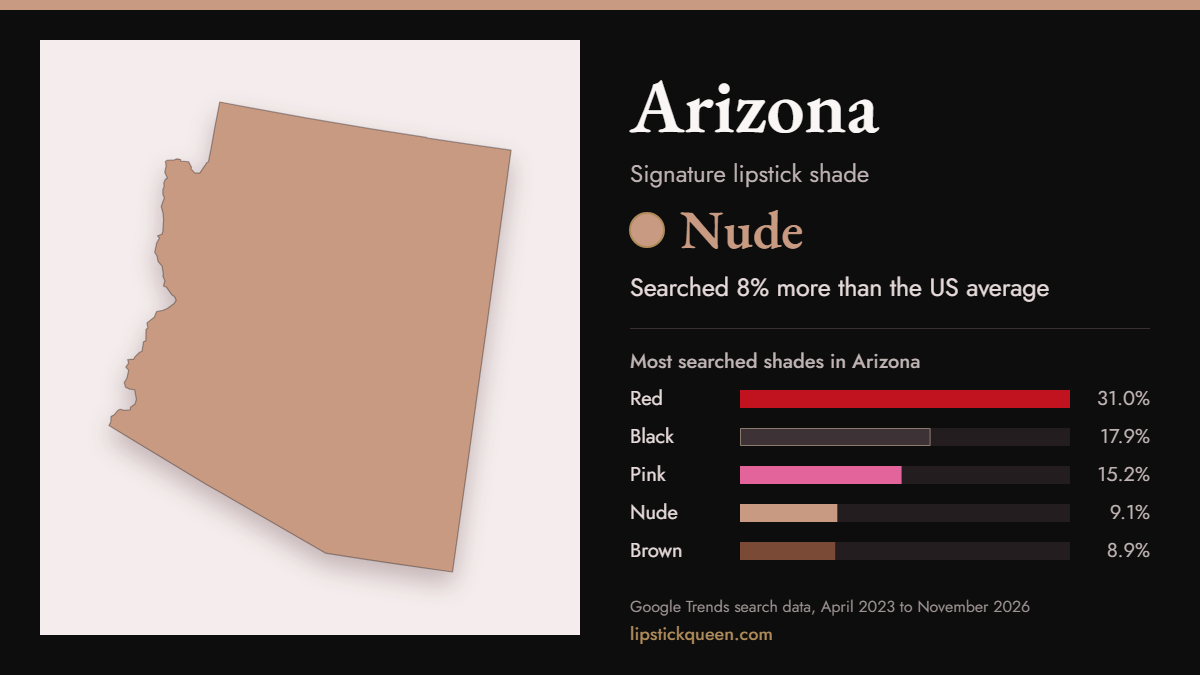
| Arizona | Nude | 8% more | Red (31.0%) | South Carolina | PNG |
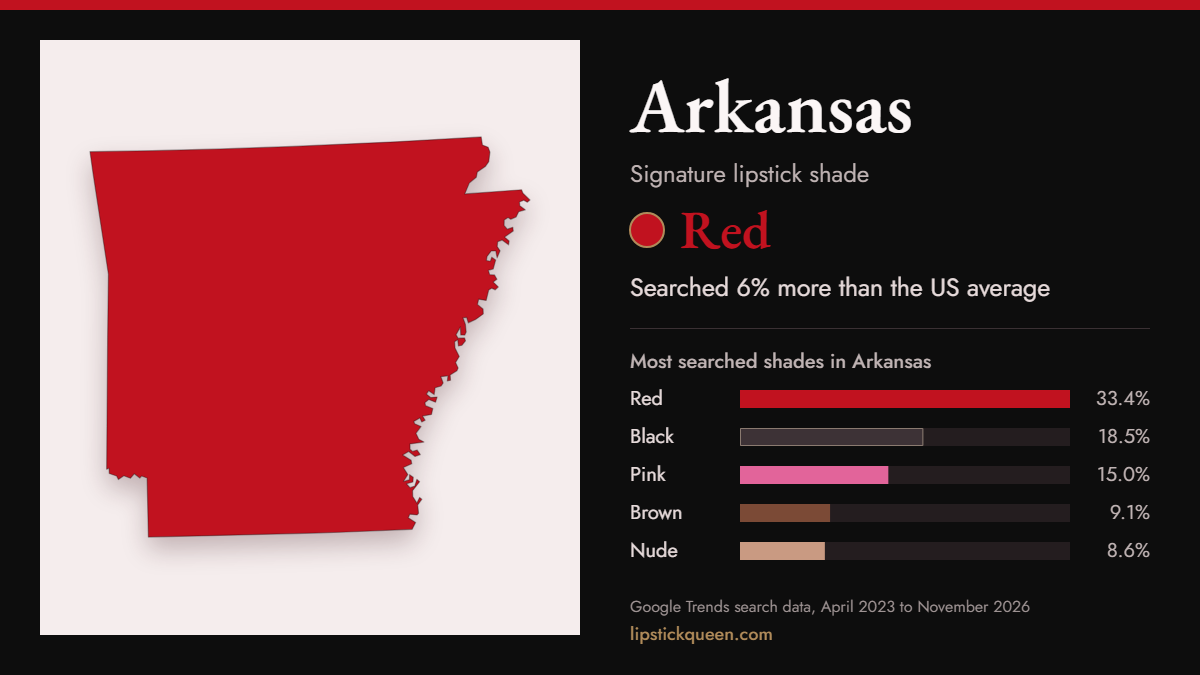
| Arkansas | Red | 6% more | Red (33.4%) | Kentucky | PNG |
| California | Brown | 10% more | Red (32.5%) | Illinois | PNG |
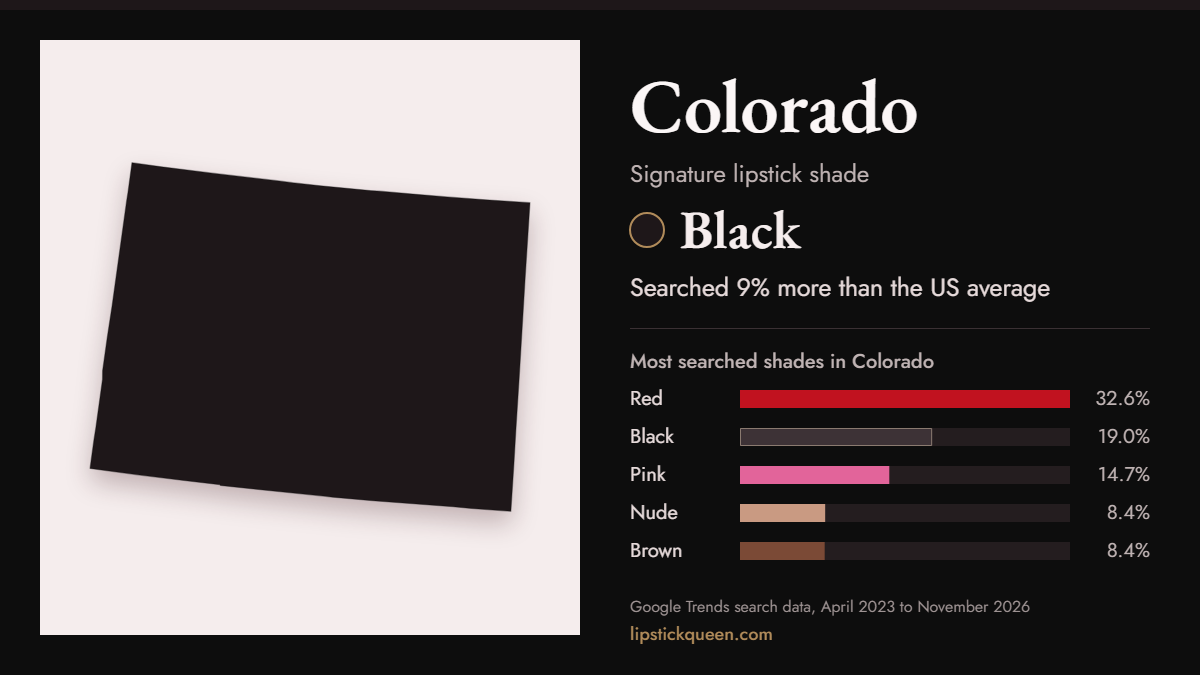
| Colorado | Black | 9% more | Red (32.6%) | Arkansas | PNG |
| Connecticut | Mauve | 26% more | Red (30.6%) | Massachusetts | PNG |
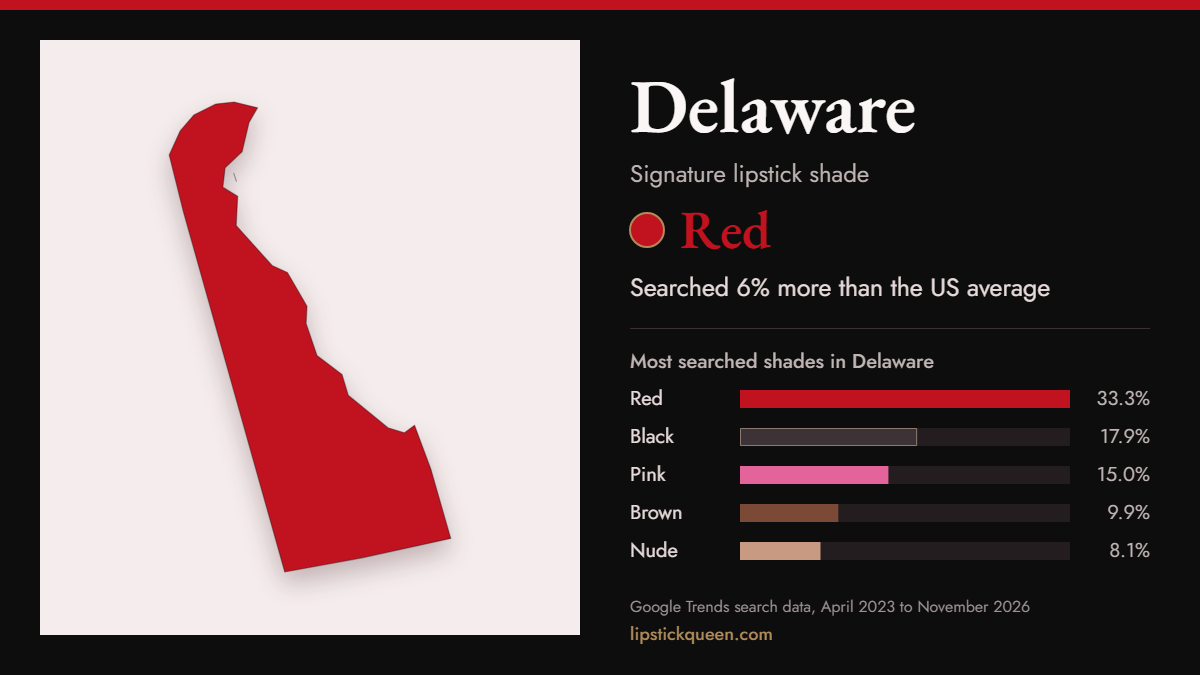
| Delaware | Red | 6% more | Red (33.3%) | District of Columbia | PNG |
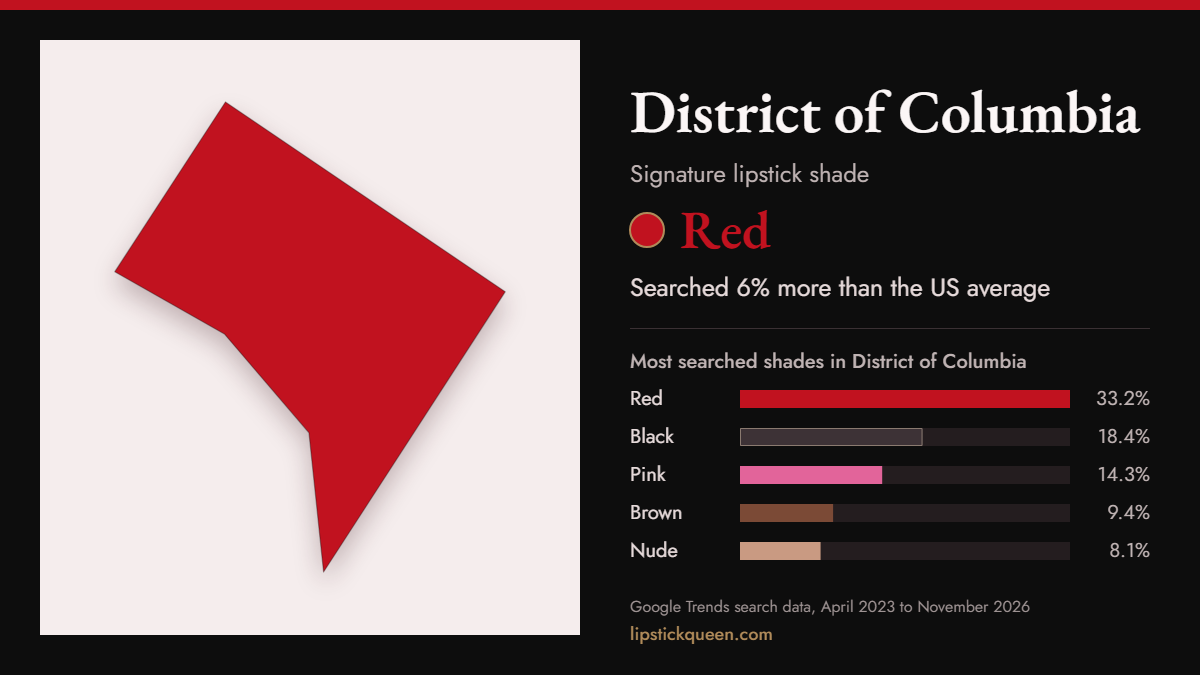
| District of Columbia | Red | 6% more | Red (33.2%) | Kentucky | PNG |
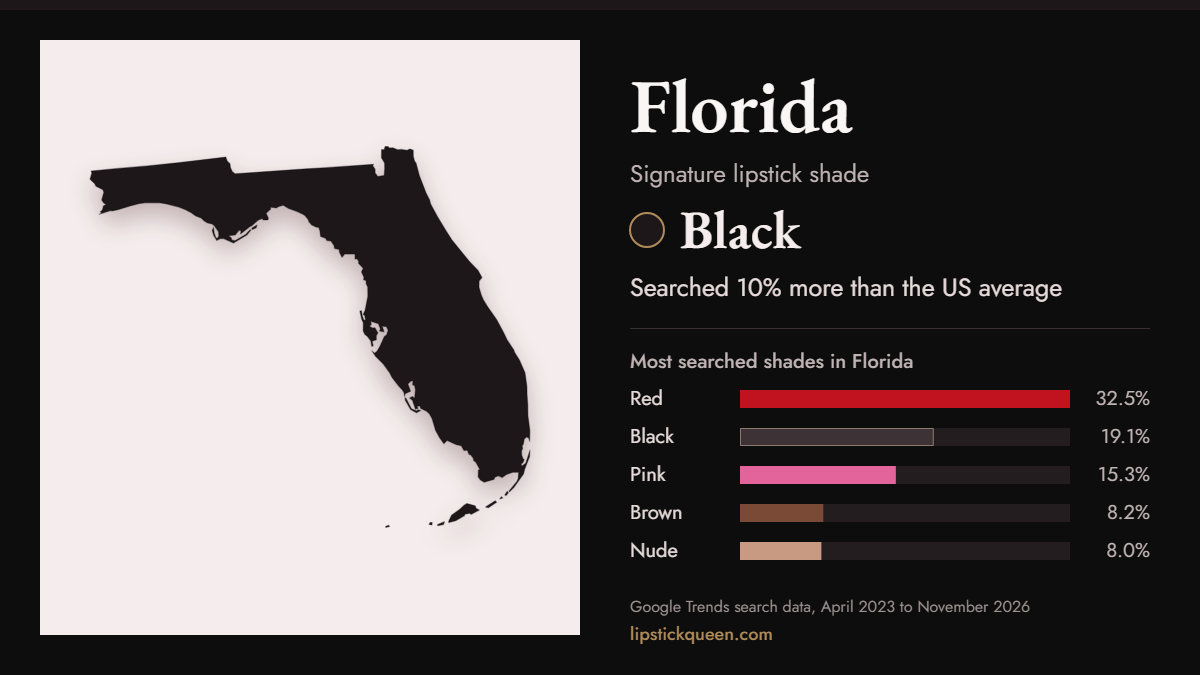
| Florida | Black | 10% more | Red (32.5%) | Colorado | PNG |
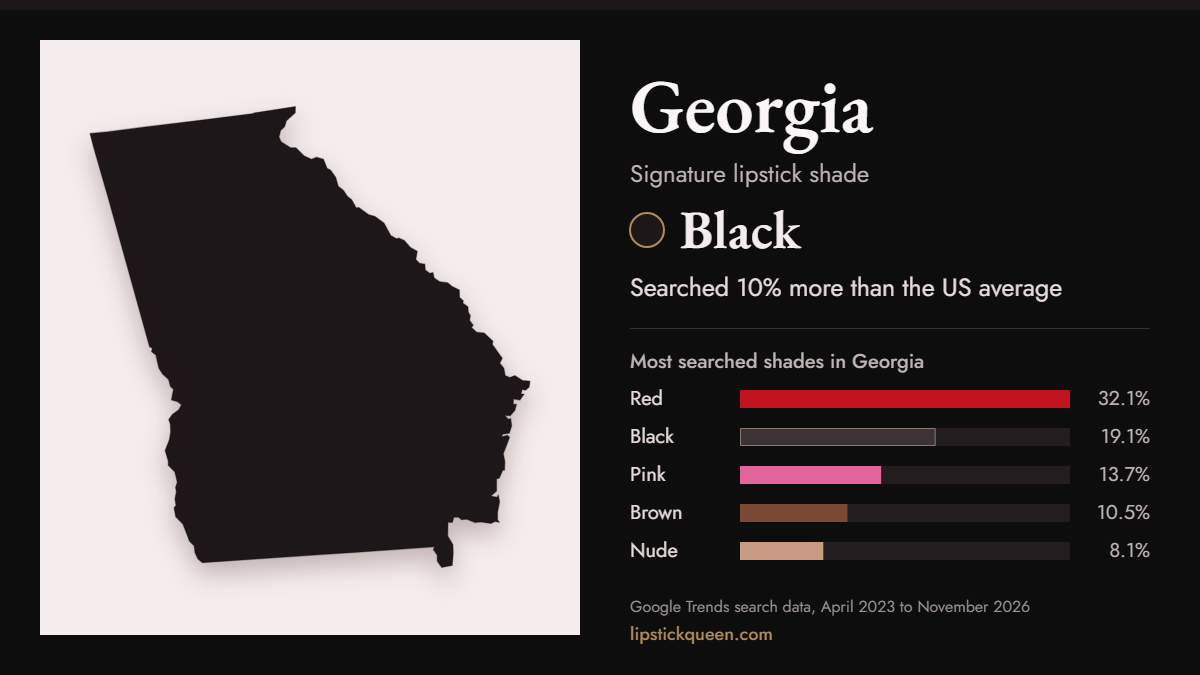
| Georgia | Black | 10% more | Red (32.1%) | Virginia | PNG |
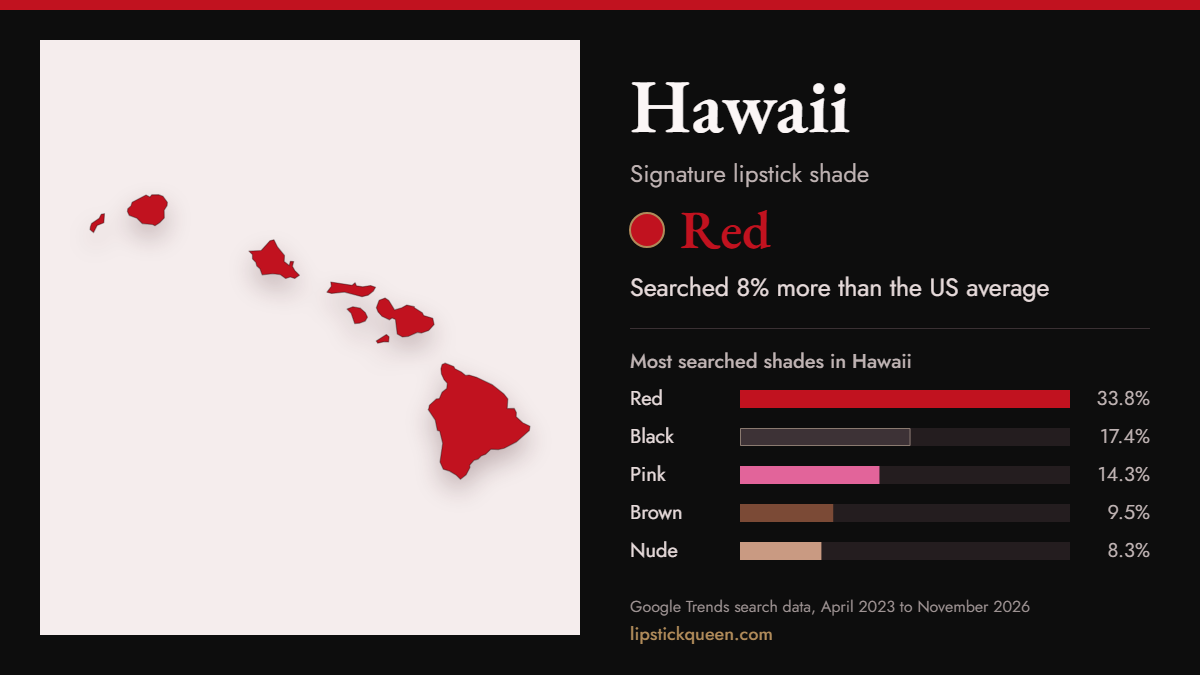
| Hawaii | Red | 8% more | Red (33.8%) | District of Columbia | PNG |
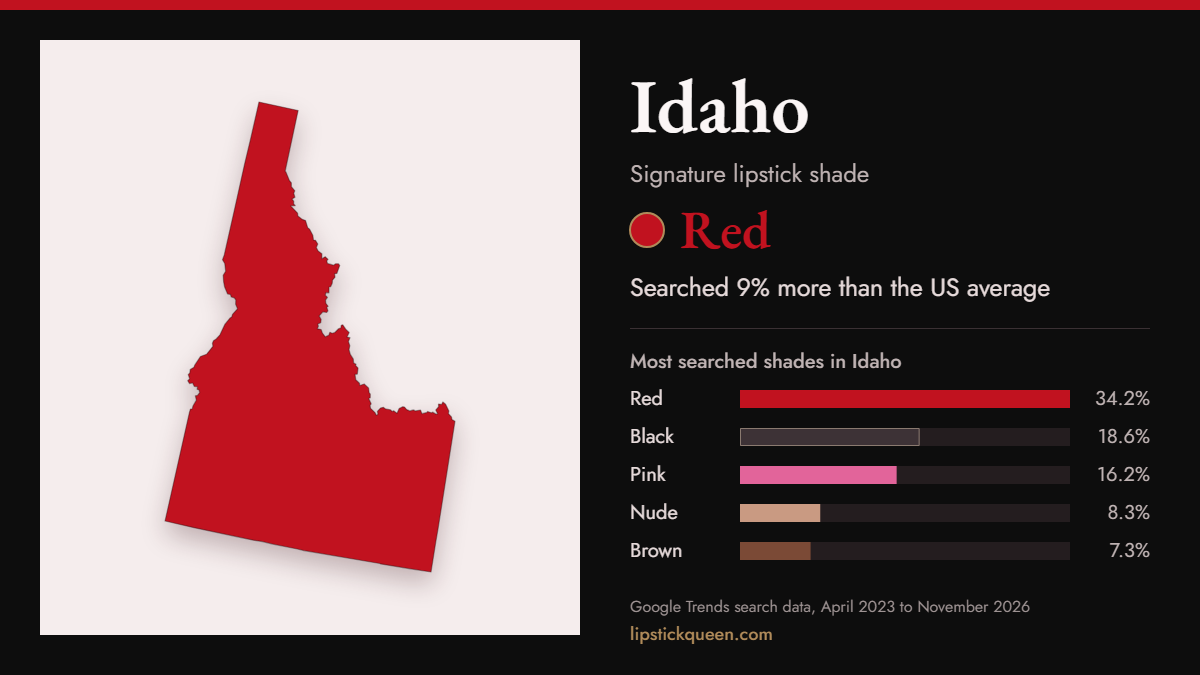
| Idaho | Red | 9% more | Red (34.2%) | Iowa | PNG |
| Illinois | Brown | 10% more | Red (32.7%) | California | PNG |
| Indiana | Black | 15% more | Red (32.6%) | Utah | PNG |
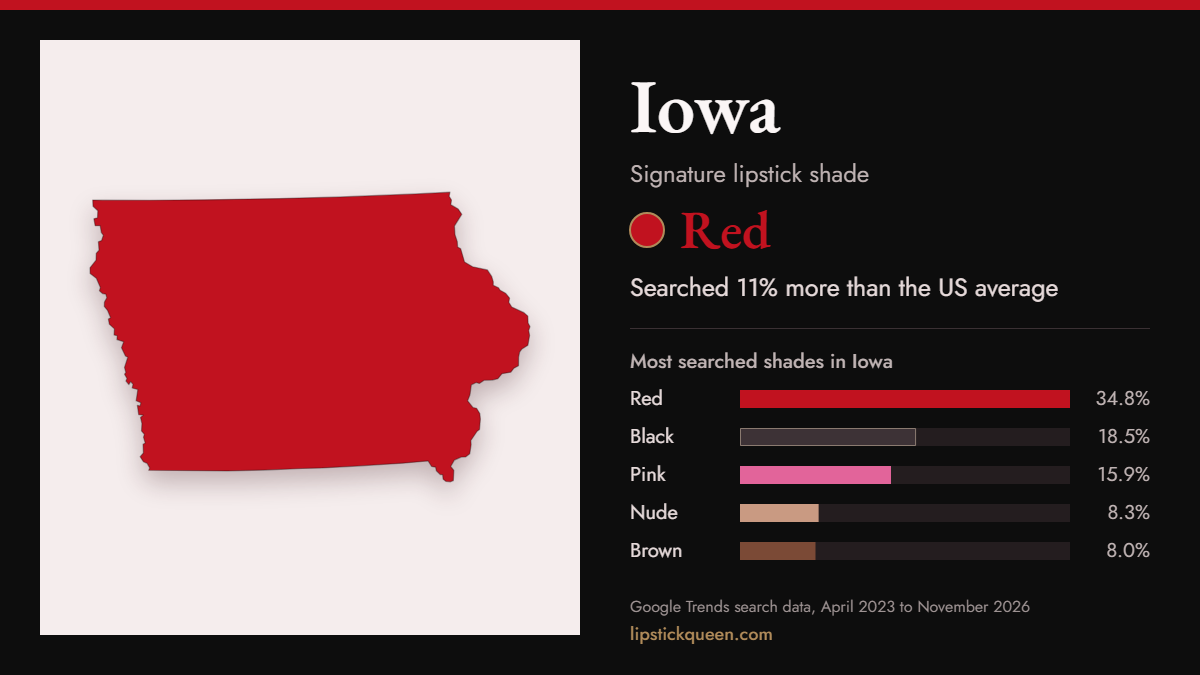
| Iowa | Red | 11% more | Red (34.8%) | Idaho | PNG |
| Kansas | Mauve | 26% more | Red (32.8%) | Wisconsin | PNG |
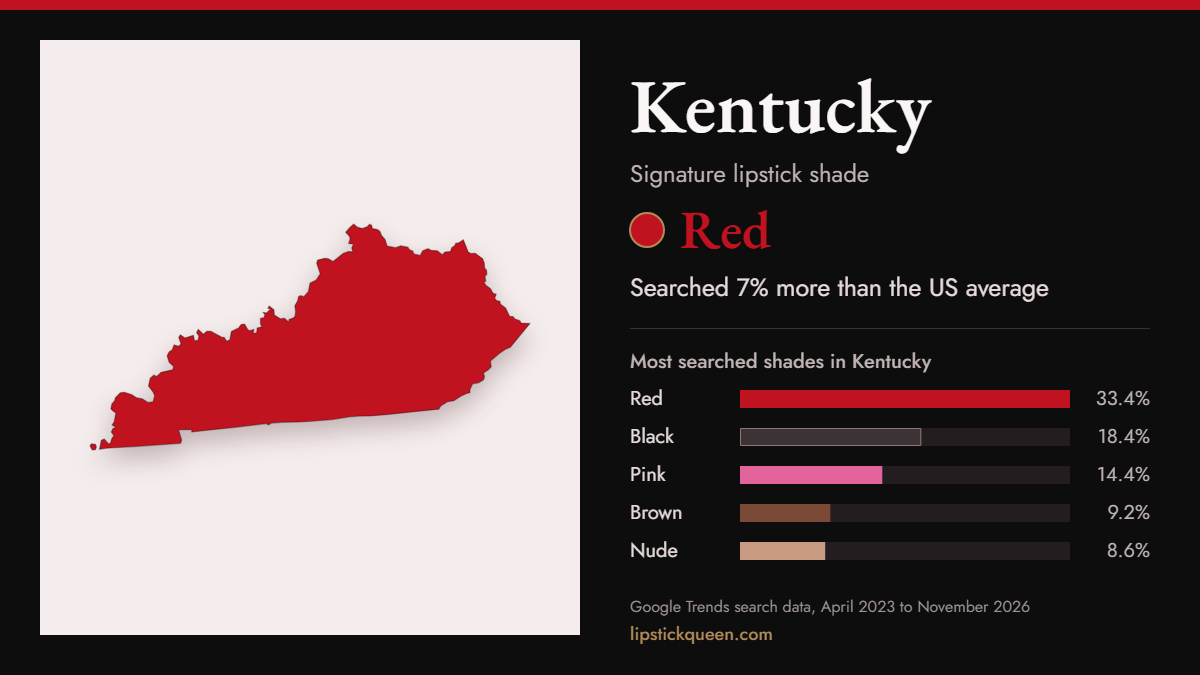
| Kentucky | Red | 7% more | Red (33.4%) | Arkansas | PNG |
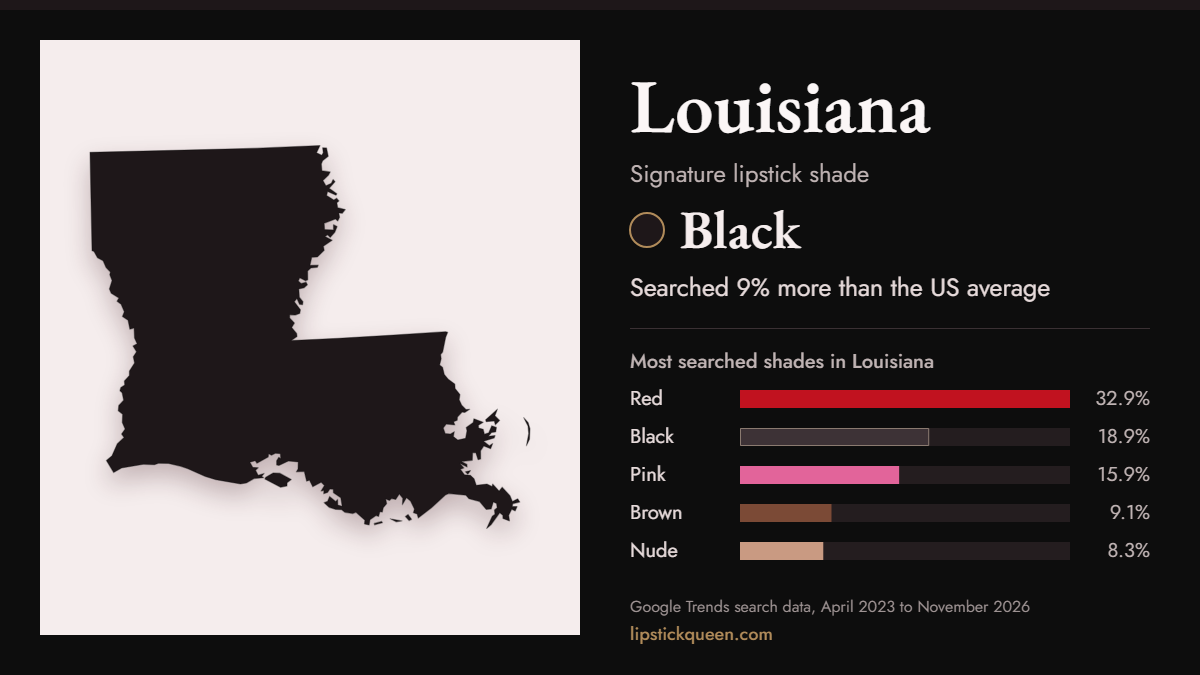
| Louisiana | Black | 9% more | Red (32.9%) | South Carolina | PNG |
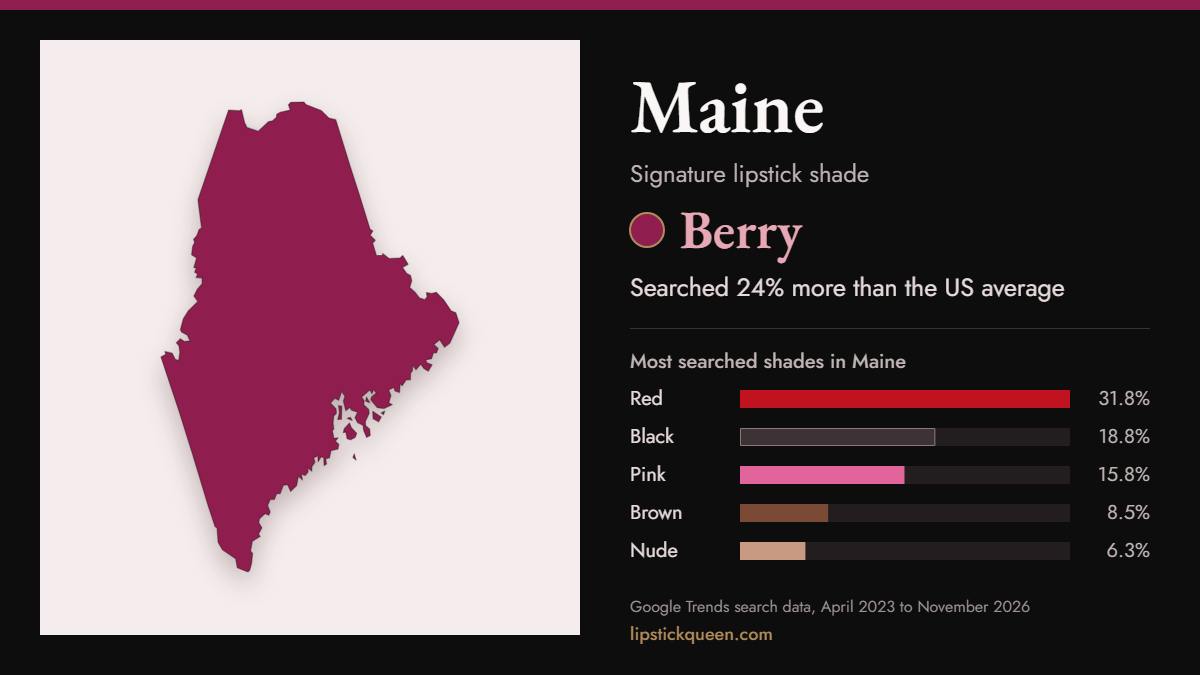
| Maine | Berry | 24% more | Red (31.8%) | Indiana | PNG |
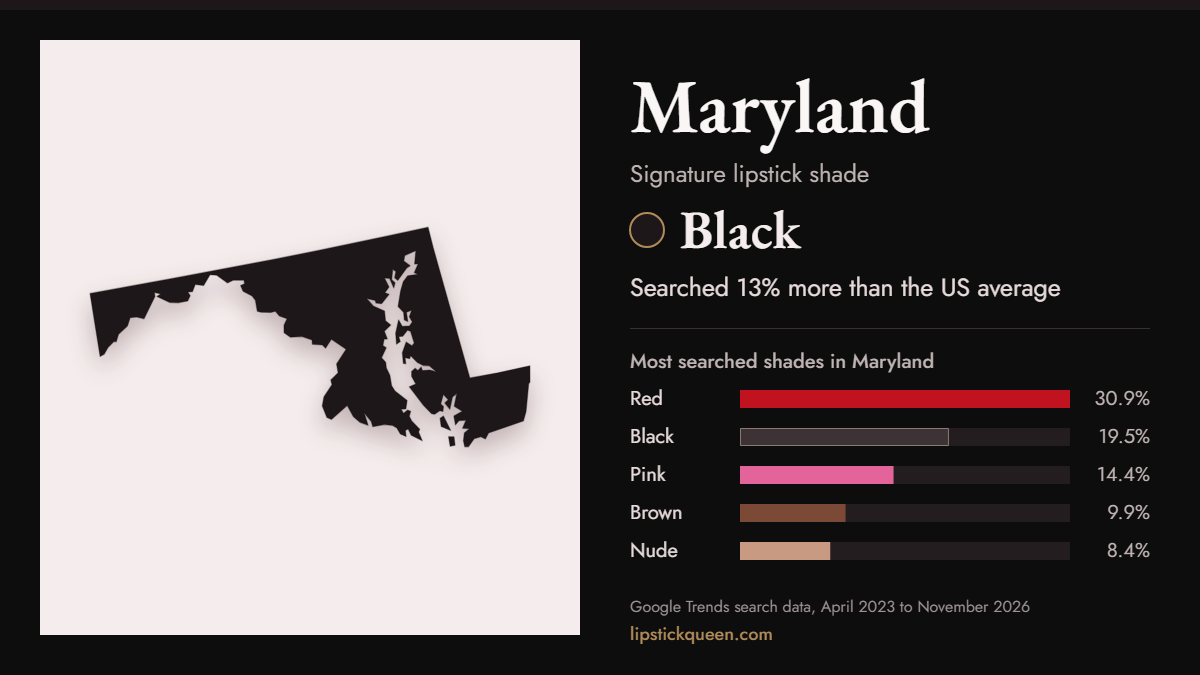
| Maryland | Black | 13% more | Red (30.9%) | Tennessee | PNG |
| Massachusetts | Mauve | 30% more | Red (29.9%) | Washington | PNG |
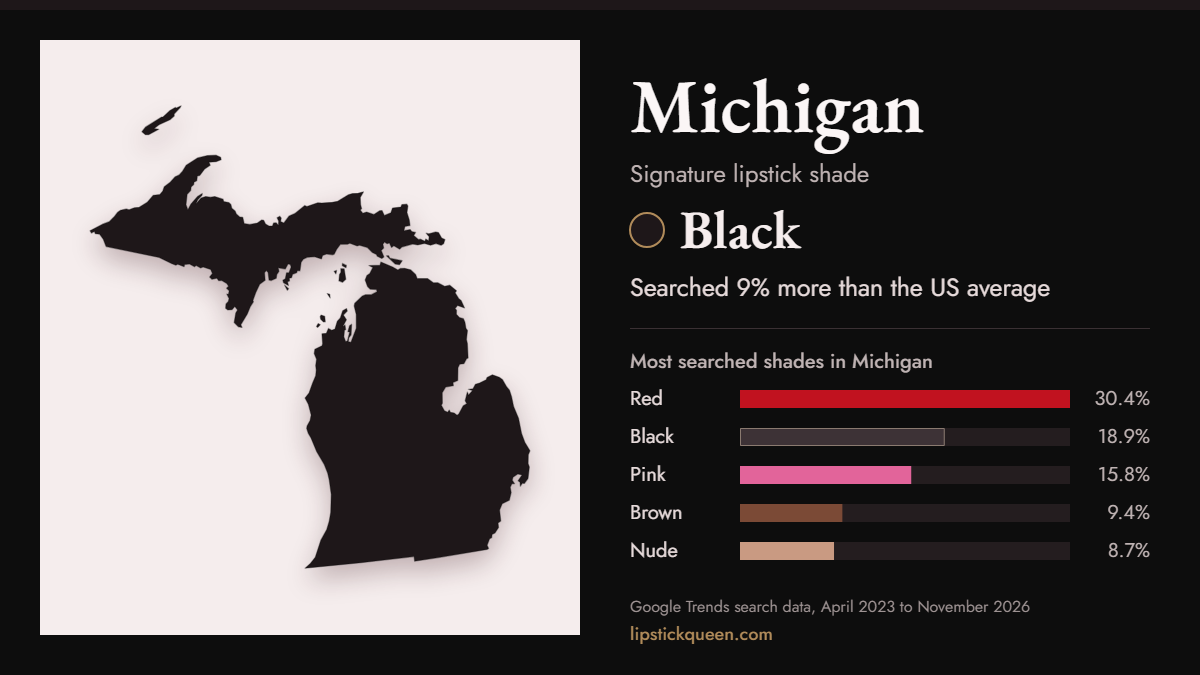
| Michigan | Black | 9% more | Red (30.4%) | Washington | PNG |
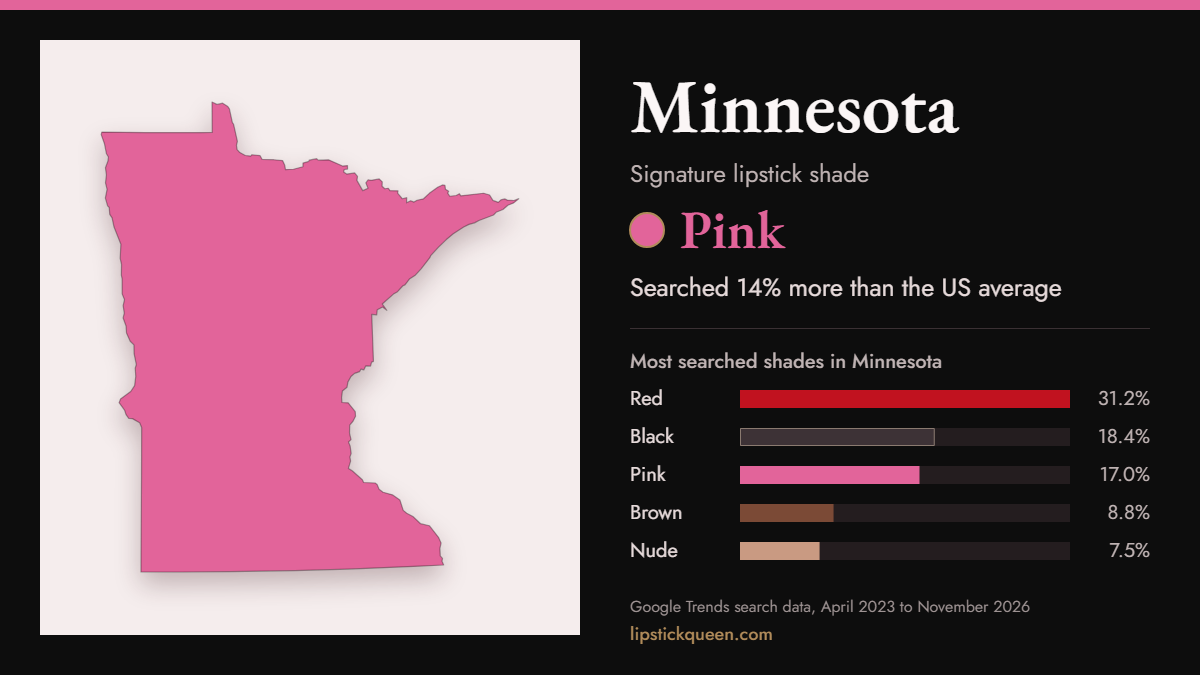
| Minnesota | Pink | 14% more | Red (31.2%) | South Carolina | PNG |
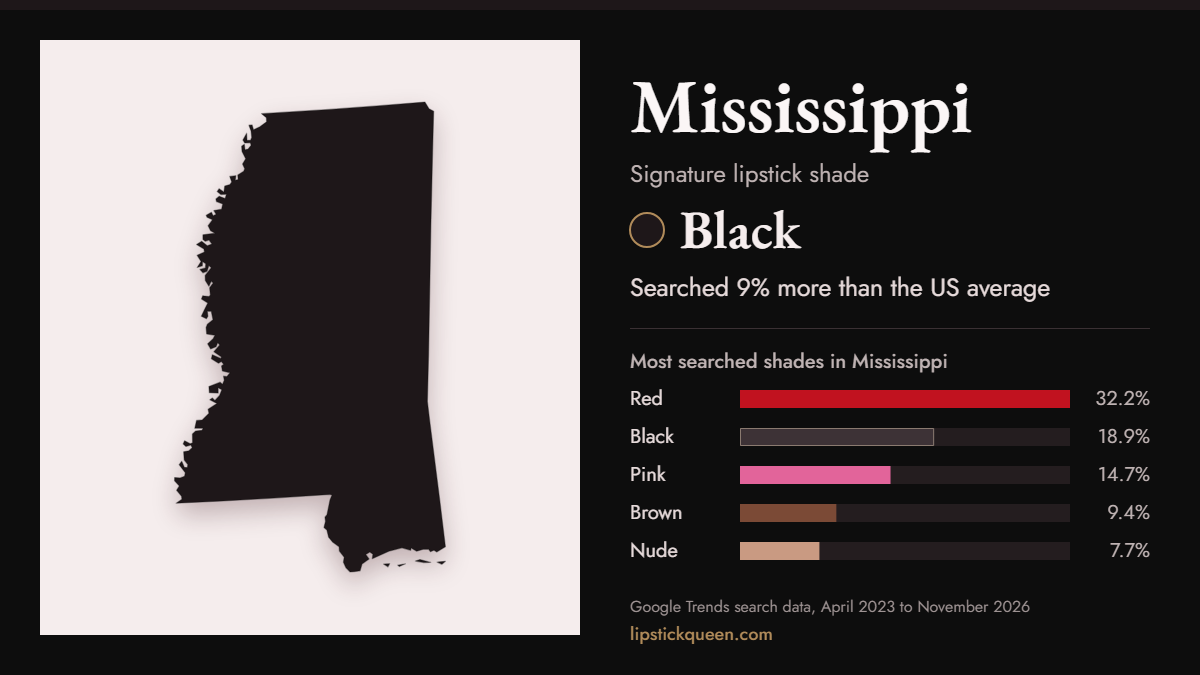
| Mississippi | Black | 9% more | Red (32.2%) | District of Columbia | PNG |
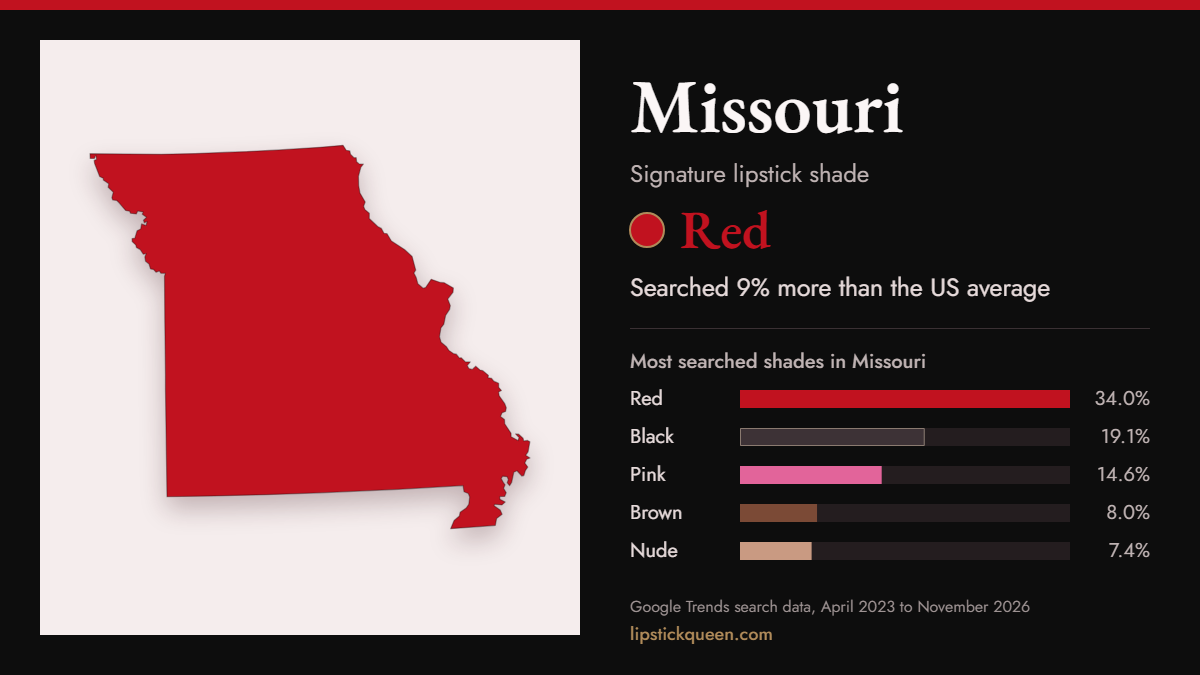
| Missouri | Red | 9% more | Red (34.1%) | Ohio | PNG |
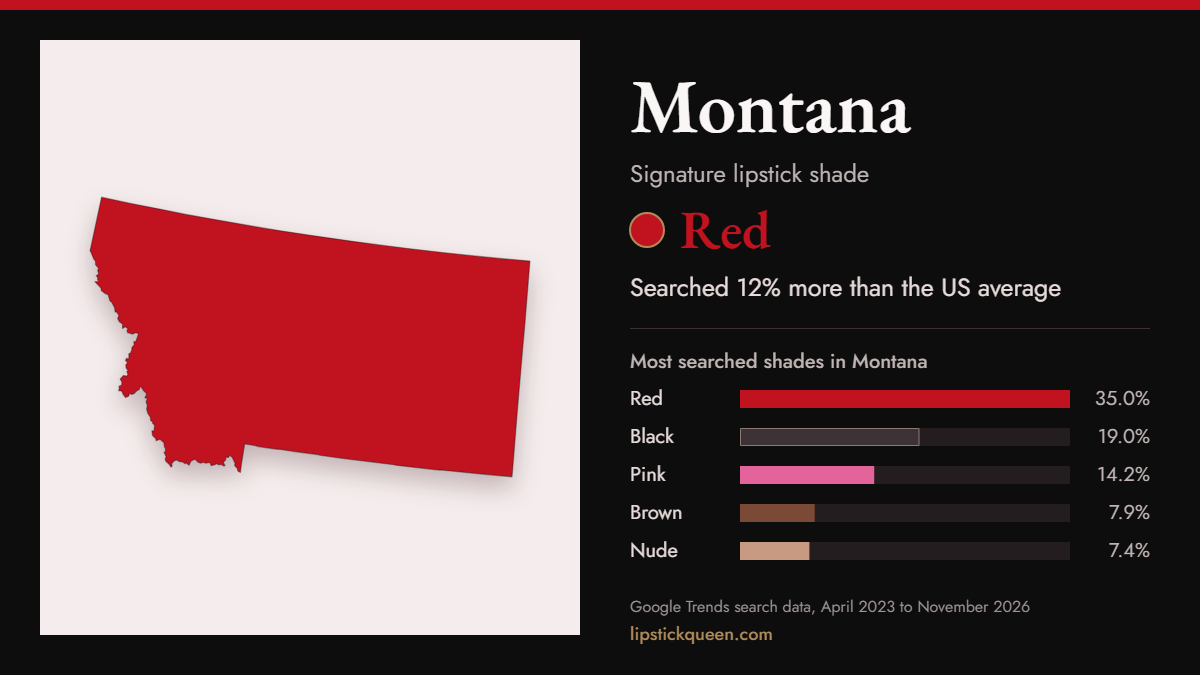
| Montana | Red | 12% more | Red (35.0%) | Alaska | PNG |
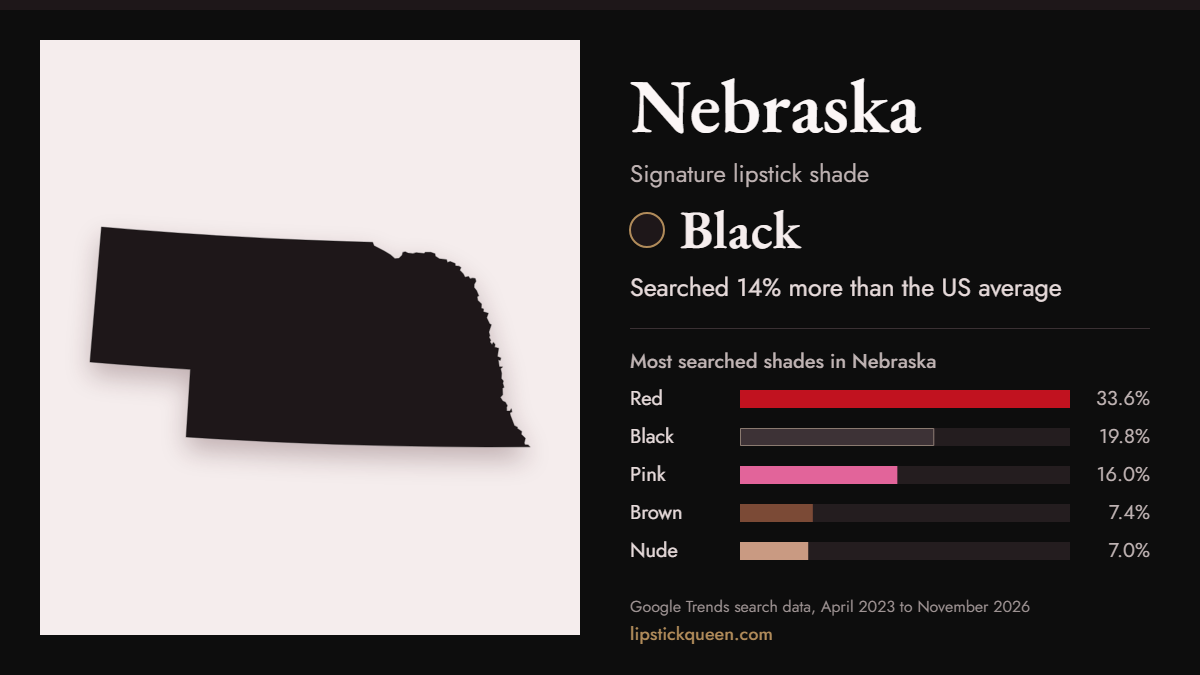
| Nebraska | Black | 14% more | Red (33.6%) | Indiana | PNG |
| Nevada | Black | 14% more | Red (32.6%) | Colorado | PNG |
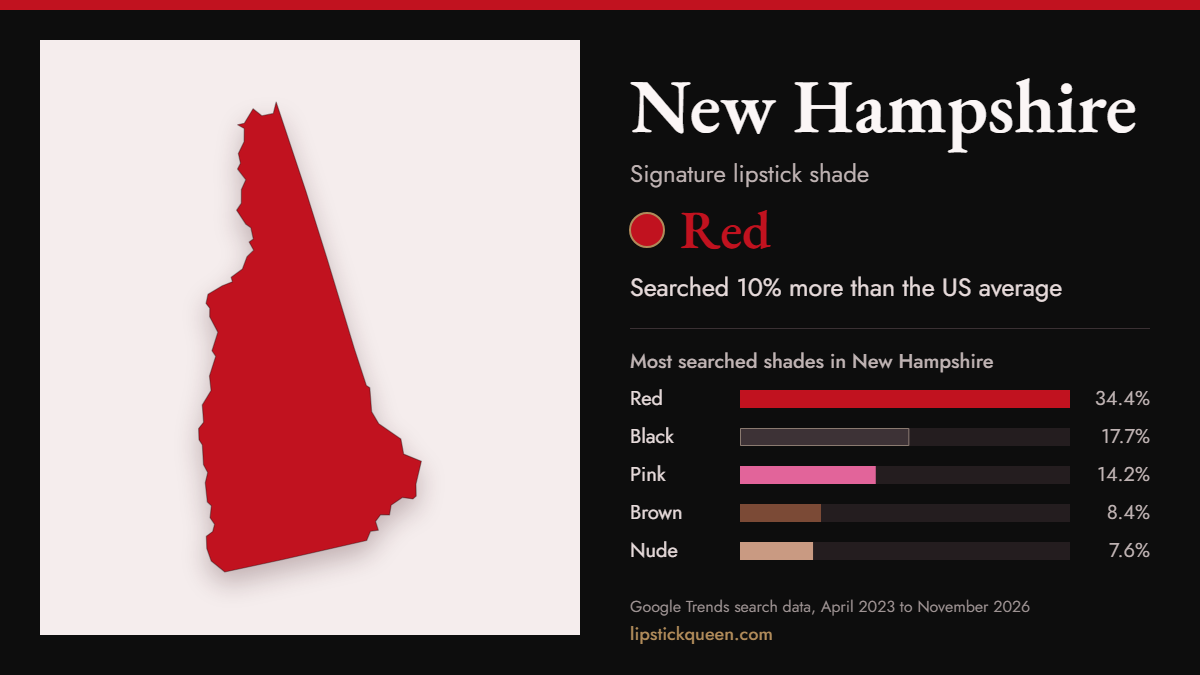
| New Hampshire | Red | 10% more | Red (34.4%) | Ohio | PNG |
| New Jersey | Brown | 21% more | Red (30.2%) | Connecticut | PNG |
| New Mexico | Black | 17% more | Red (33.6%) | Colorado | PNG |
| New York | Coral | 49% more | Red (34.9%) | Texas | PNG |
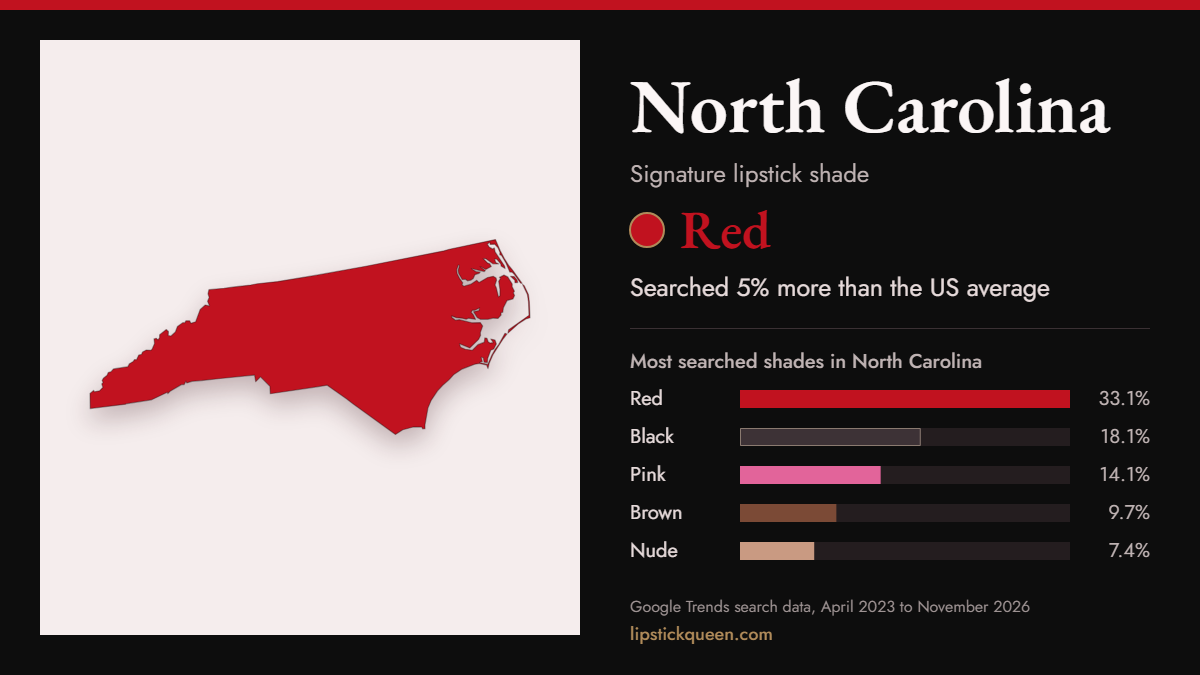
| North Carolina | Red | 5% more | Red (33.1%) | Kentucky | PNG |
| North Dakota | Red | 23% more | Red (38.5%) | New York | PNG |
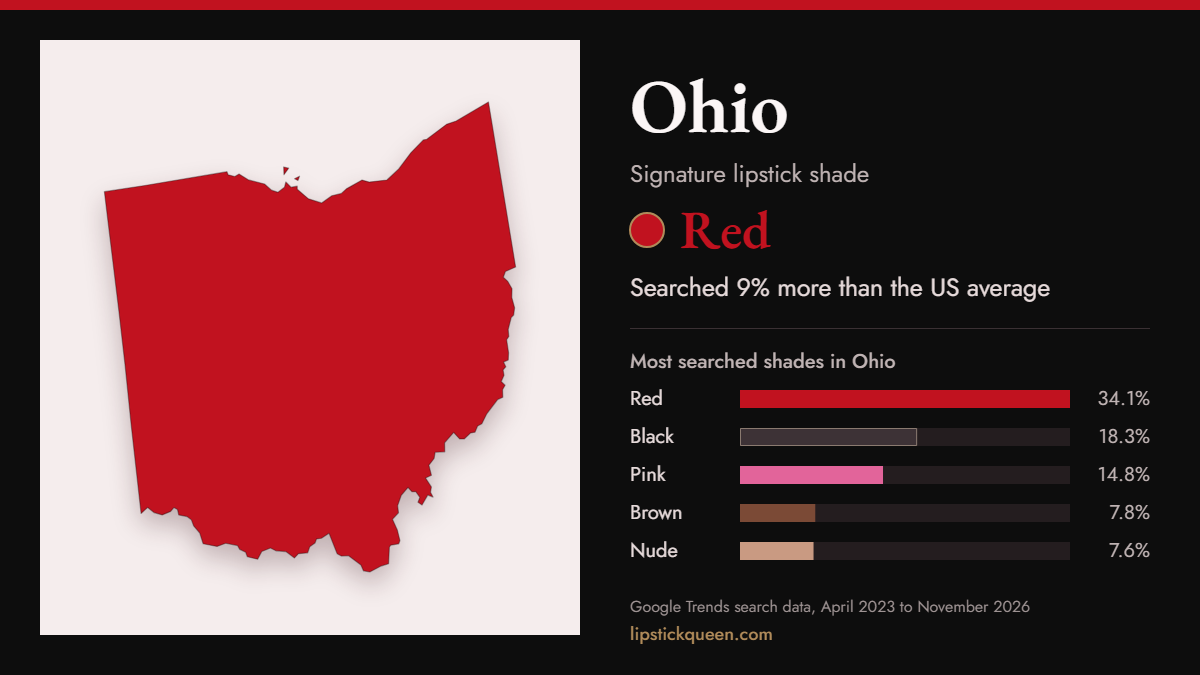
| Ohio | Red | 9% more | Red (34.2%) | Missouri | PNG |
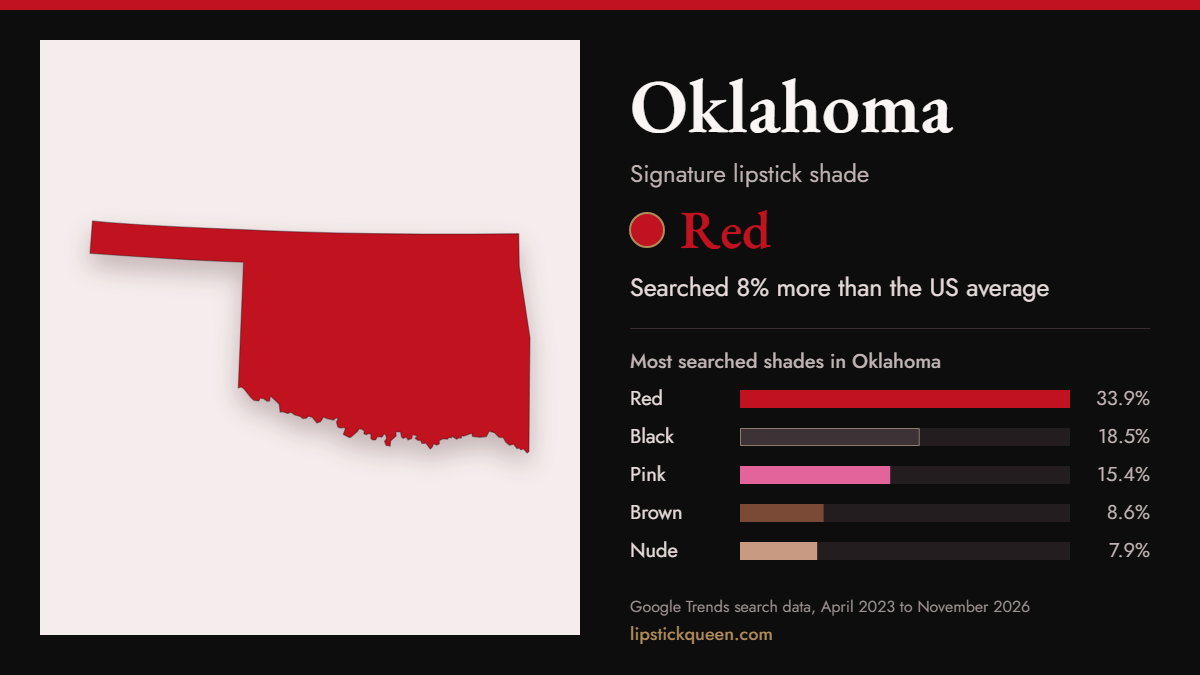
| Oklahoma | Red | 8% more | Red (33.9%) | Wyoming | PNG |
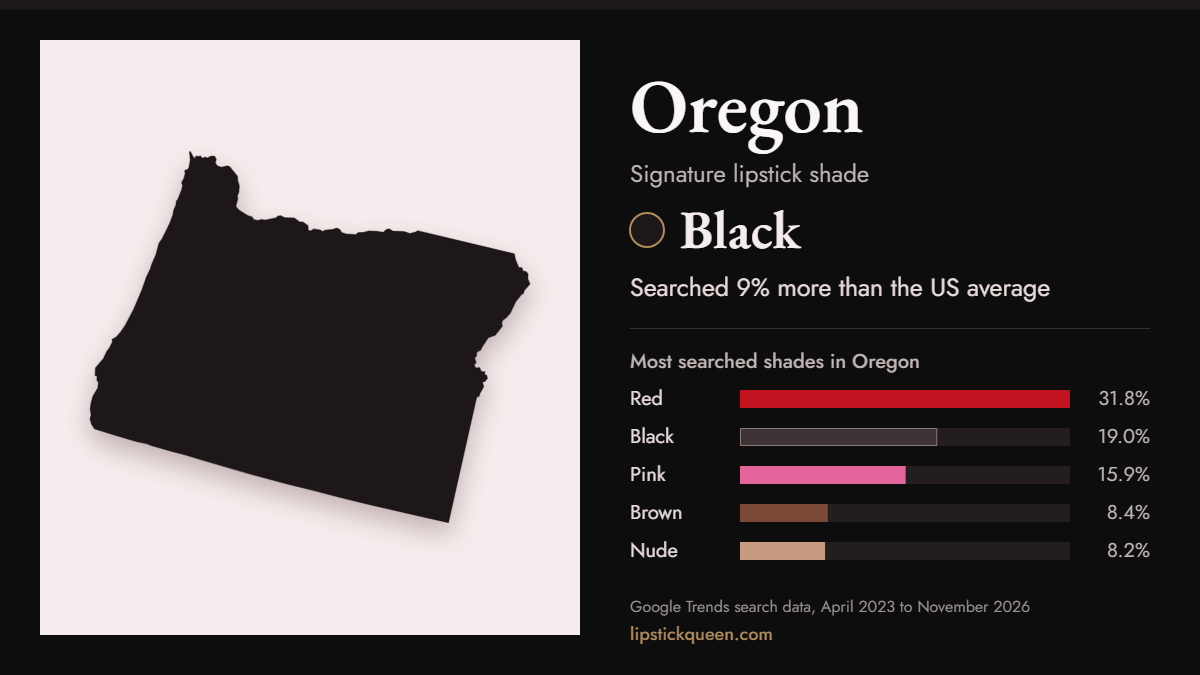
| Oregon | Black | 9% more | Red (31.8%) | South Carolina | PNG |
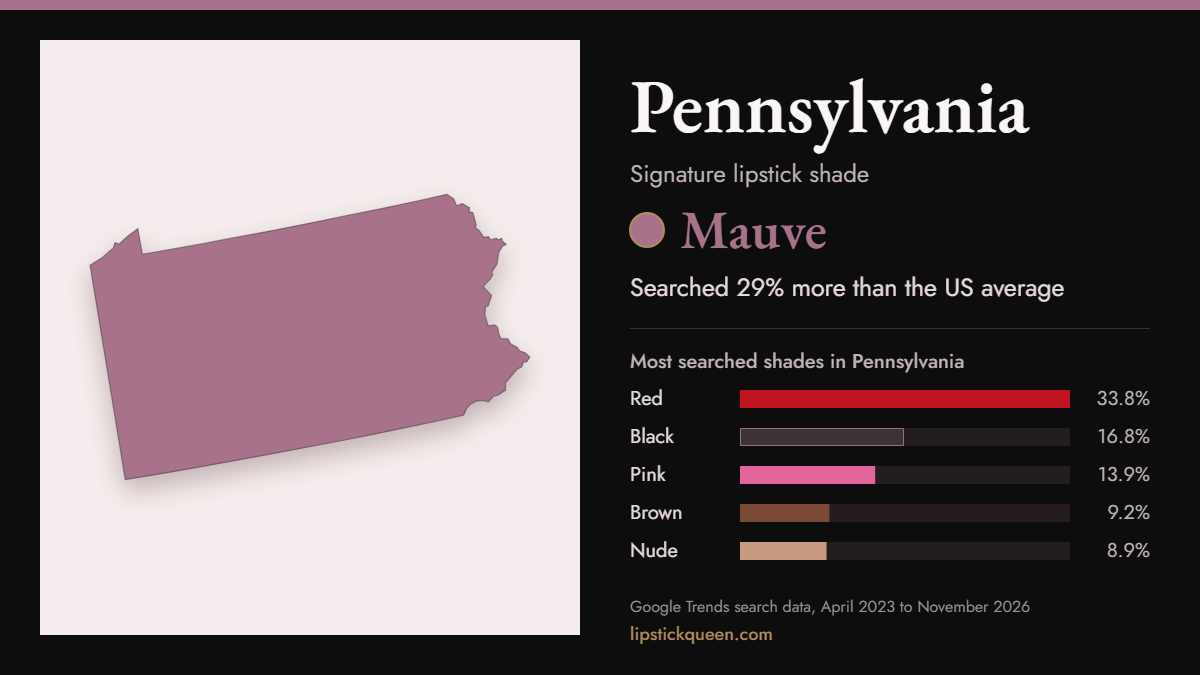
| Pennsylvania | Mauve | 29% more | Red (33.8%) | Illinois | PNG |
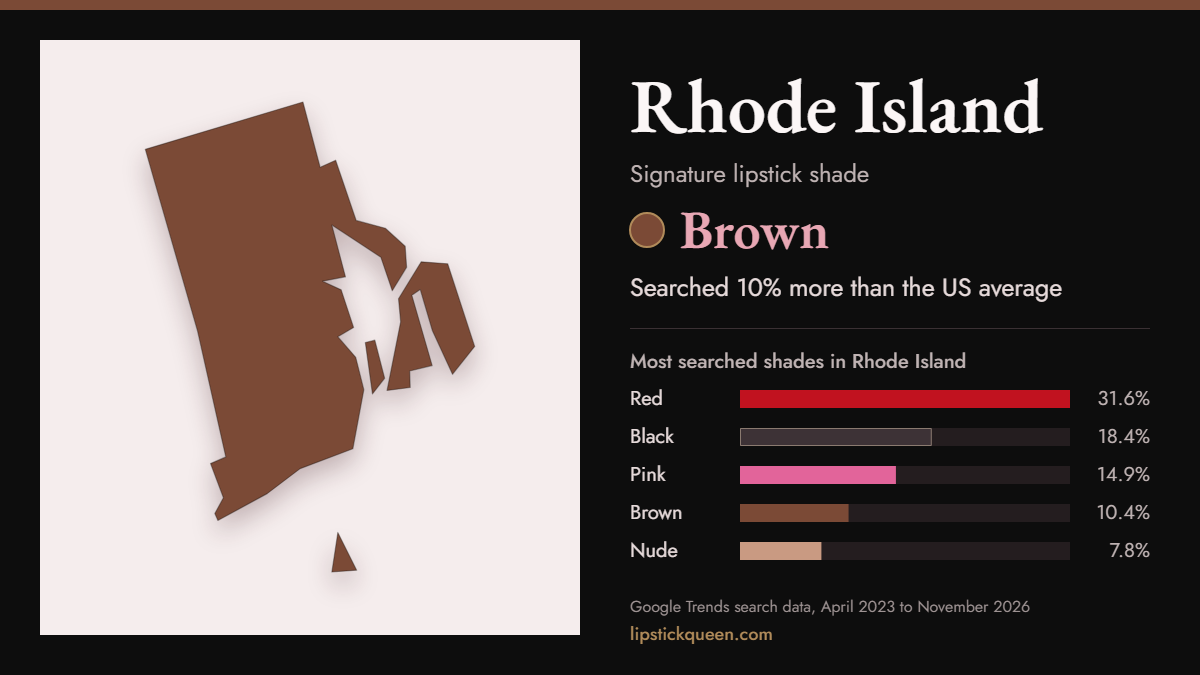
| Rhode Island | Brown | 10% more | Red (31.6%) | Tennessee | PNG |
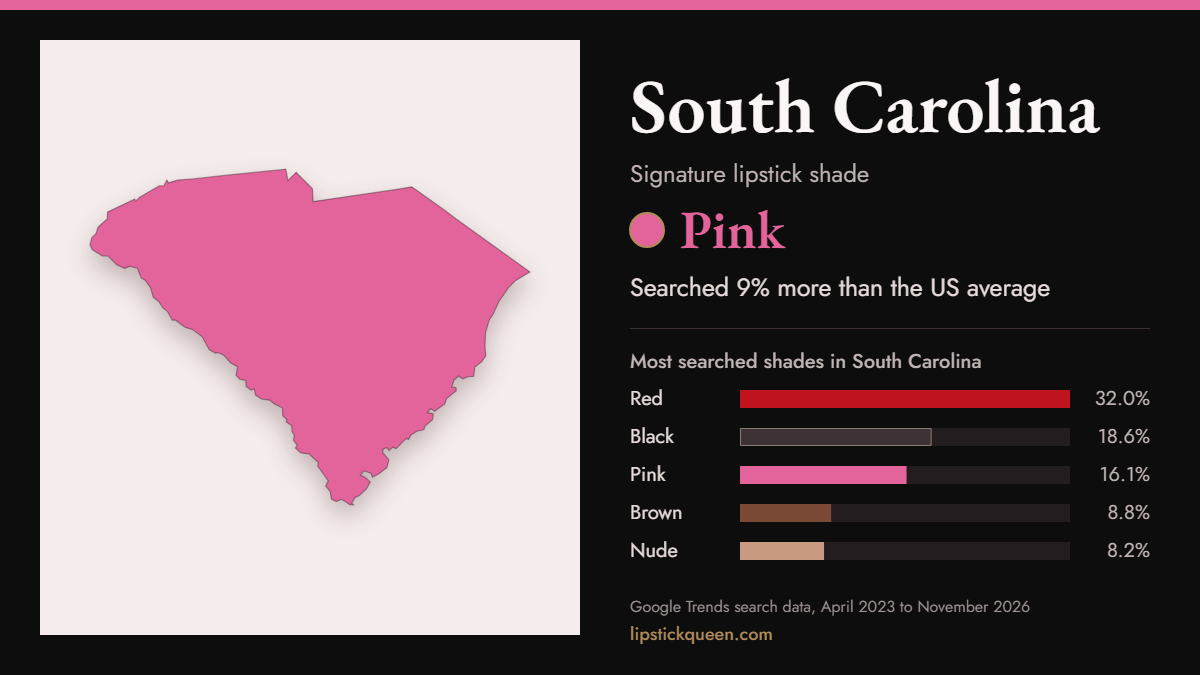
| South Carolina | Pink | 9% more | Red (32.0%) | Oregon | PNG |
| South Dakota | Red | 19% more | Red (37.4%) | Vermont | PNG |
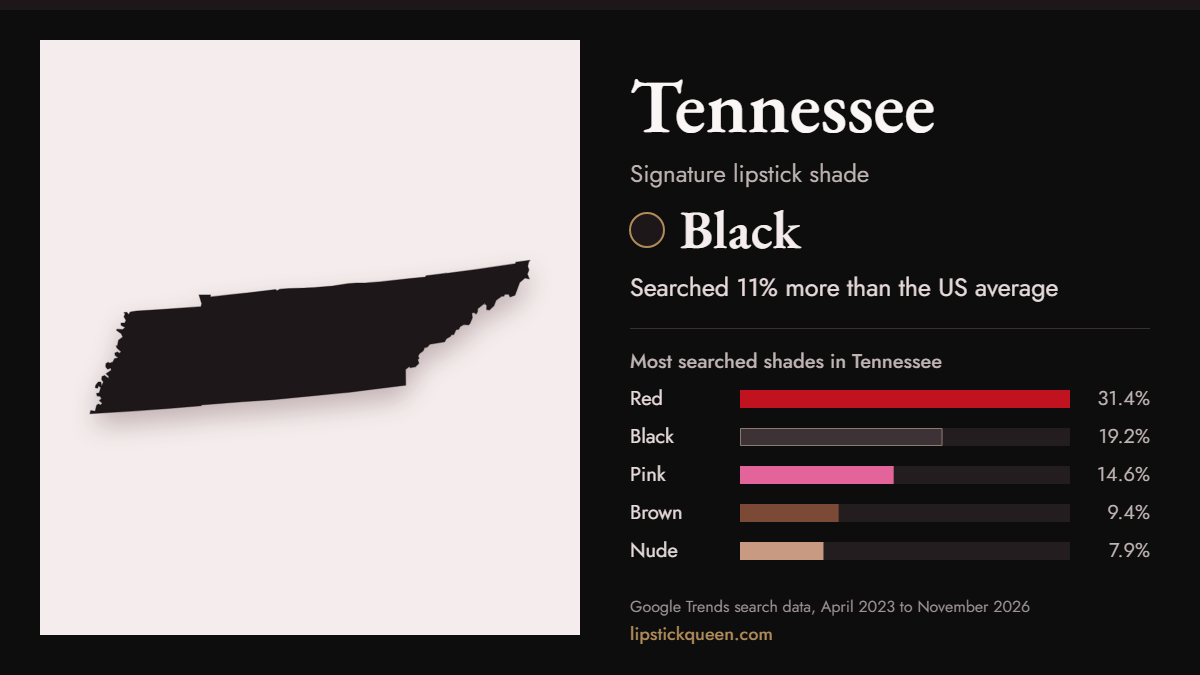
| Tennessee | Black | 11% more | Red (31.4%) | Alabama | PNG |
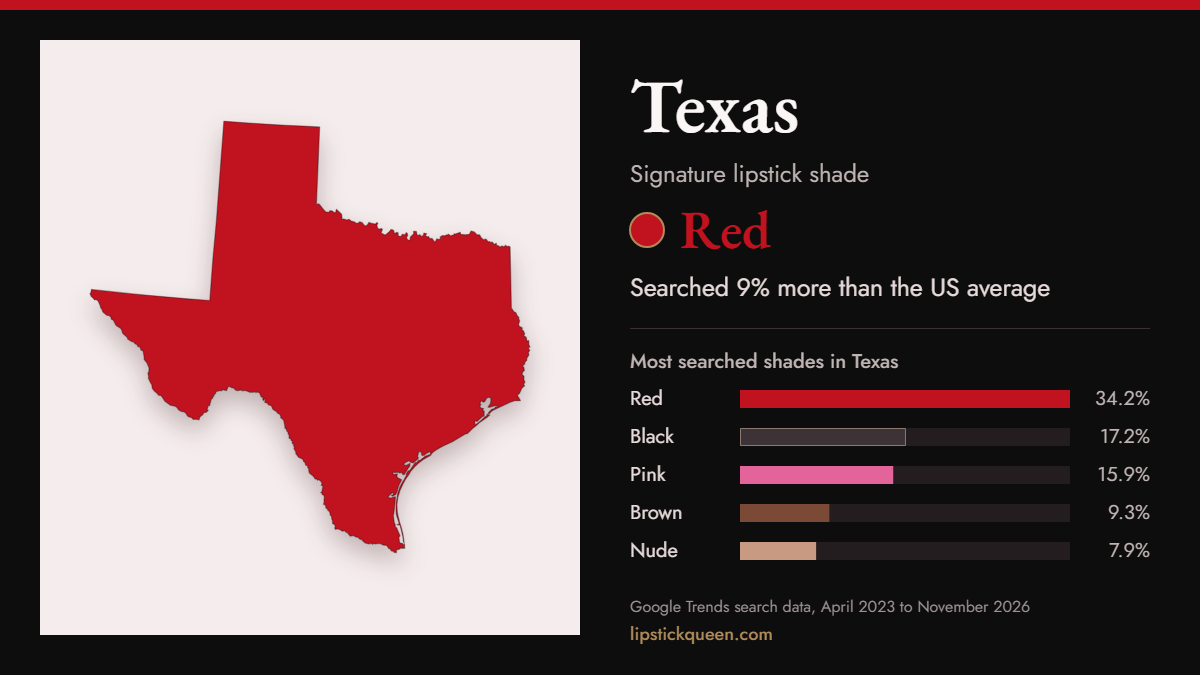
| Texas | Red | 9% more | Red (34.2%) | Wisconsin | PNG |
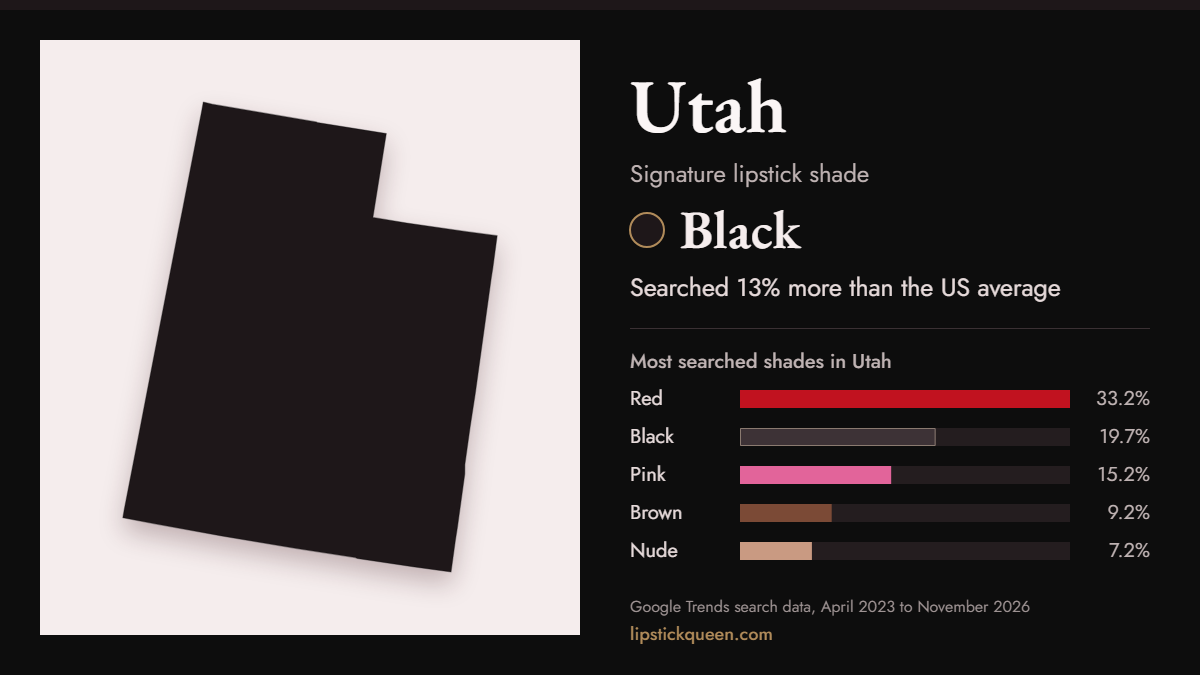
| Utah | Black | 13% more | Red (33.2%) | Indiana | PNG |
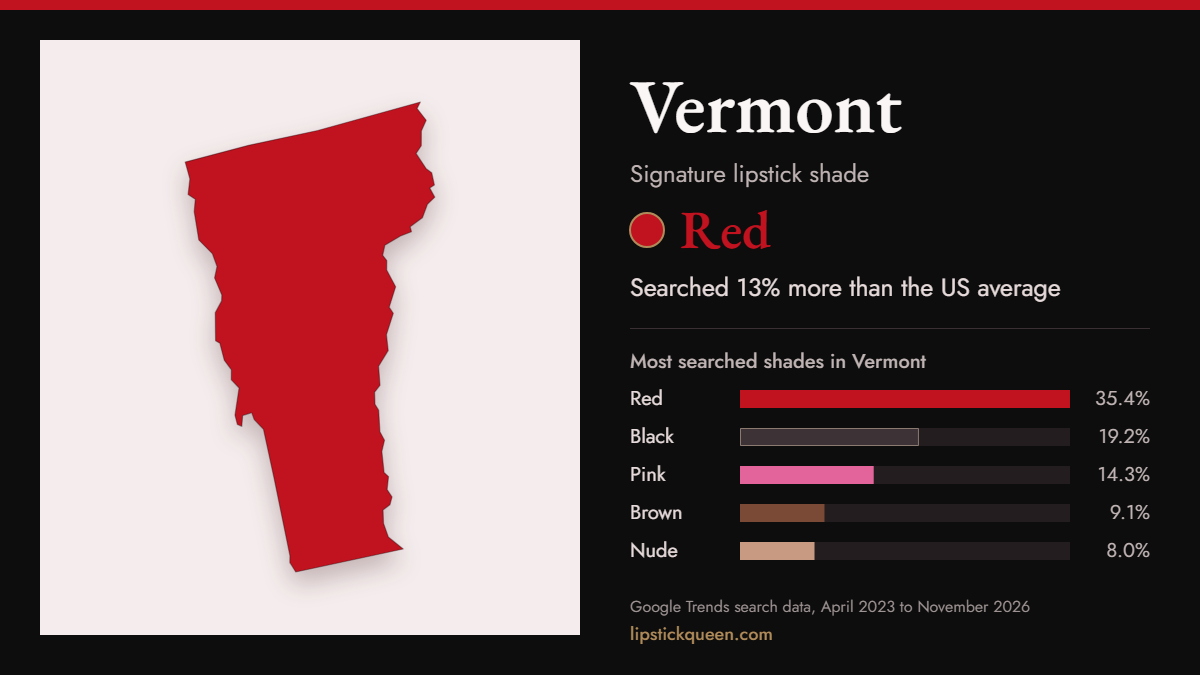
| Vermont | Red | 13% more | Red (35.4%) | Wyoming | PNG |
| Virginia | Mauve | 25% more | Red (31.4%) | Alabama | PNG |
| Washington | Black | 9% more | Red (30.3%) | Michigan | PNG |
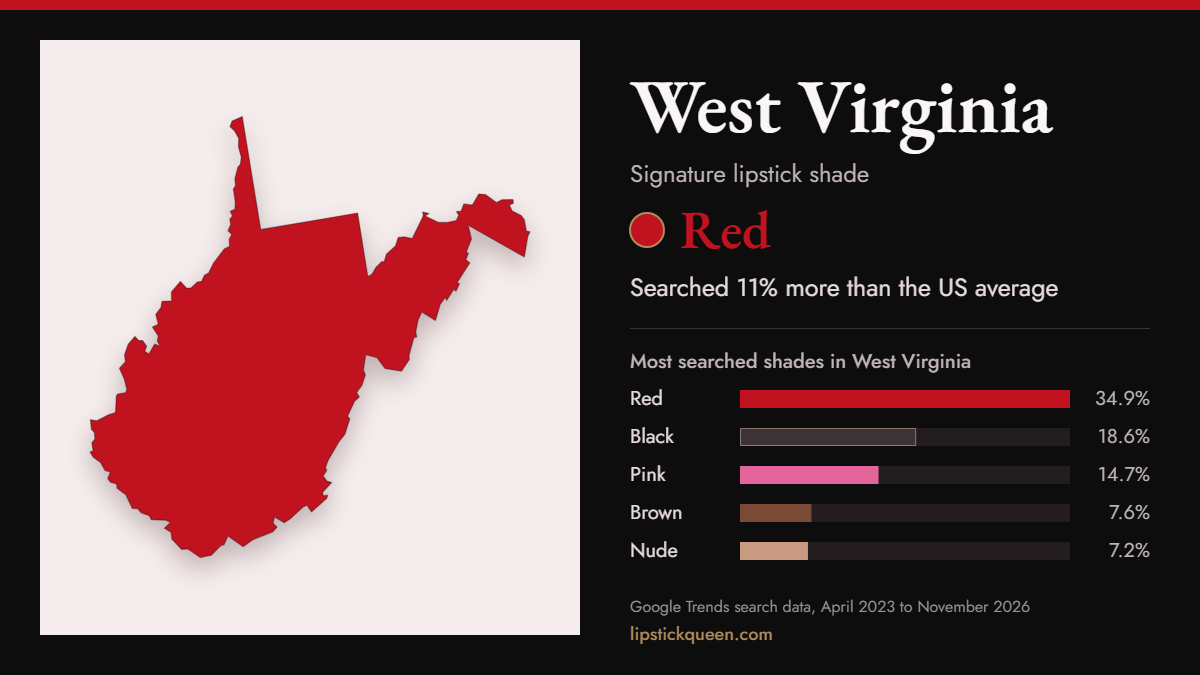
| West Virginia | Red | 11% more | Red (34.9%) | Ohio | PNG |
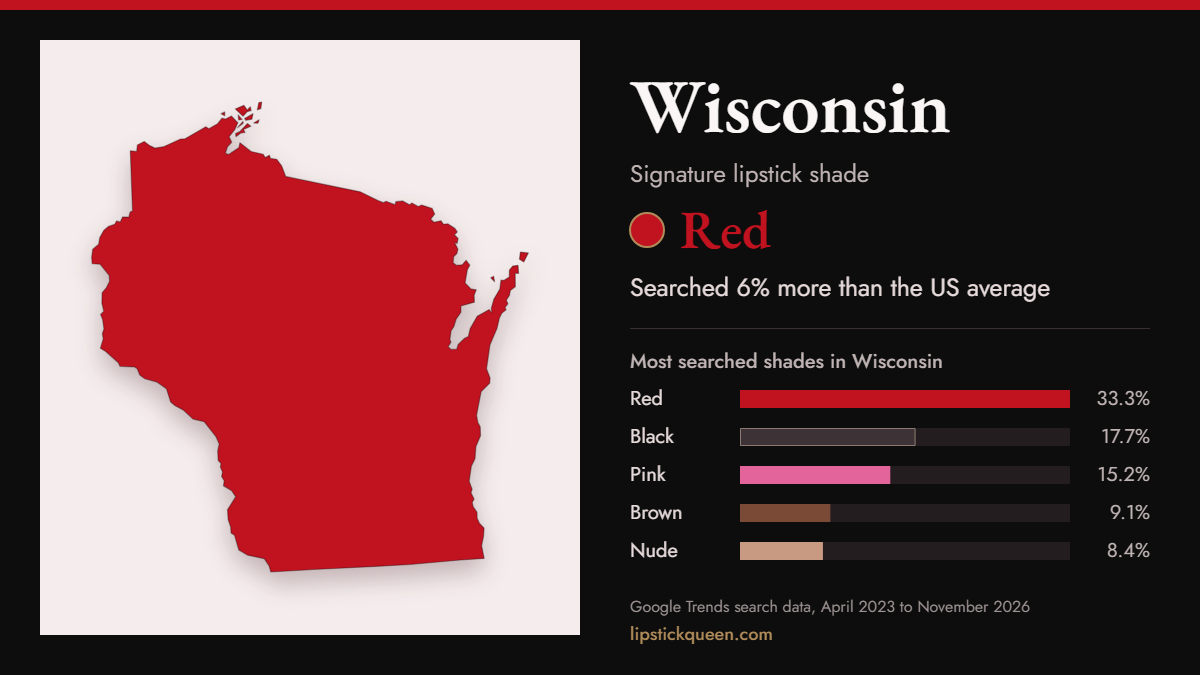
| Wisconsin | Red | 6% more | Red (33.3%) | Arkansas | PNG |
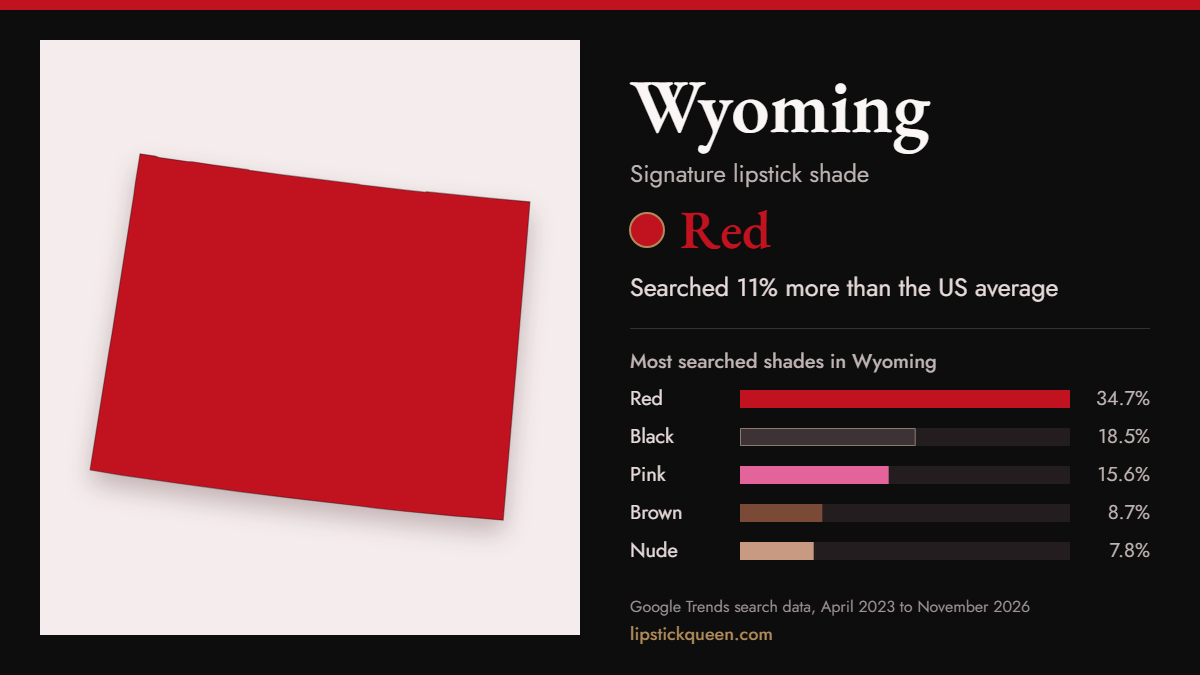
| Wyoming | Red | 11% more | Red (34.7%) | Oklahoma | PNG |